Introducing Line Charts: A Smarter Way to See Stock Movements

The all-new Shoonya gives you dedicated dashboards for F&O, stocks, and IPOs. But did you know? You also get Line Charts. Simple yet powerful, they help you track stock movements with ease. Have you tried them yet? With just one glance, you can spot whether prices are going up, down, or staying flat.
This makes it easier to follow market trends, find the right opportunities, and make decisions with confidence. At Shoonya, we’re always invested in your growth, and Line Charts are here to make your trading journey smoother.

New Line Chart Dashboard
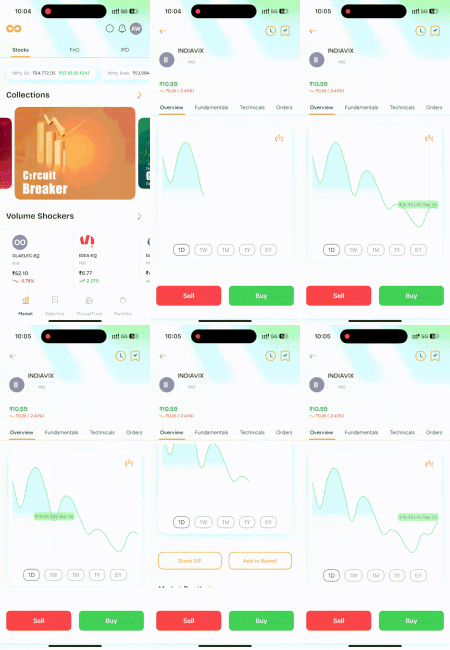
Line Charts make stock analysis clearer, faster, and more accessible for every investor. In New Shoonya, we have combined charts, performance market depth, company insights, and one-tap Buy/Sell options in a single screen.
Here’s what you get in the new setup:
- Simple and Easy to Read Line Charts
Instantly track stock performance for 1 day, 1 week, 1 month, 1 year, or even 5 years; all on one screen. This helps you understand both short-term movements and long-term trends without opening separate windows. - Market Depth at a Glance
Now, you can see the live bid and ask prices with quantities right below the chart. This makes it easier to judge demand and supply before you make a move. - Company & Performance Info
Get a quick snapshot of the company and its performance, so you don’t have to leave the dashboard for basic details. - Buy and Sell in One Tap
The Buy and Sell buttons are right at the bottom of the screen. Once you’re confident with the chart and data, you can place your order immediately. - Switch to Candle View Anytime
For traders who prefer detailed candlestick patterns, you can tap to Candle View directly from the chart. This flexibility means the dashboard works for both beginners and advanced users.
How to Use Line Charts on Shoonya
Accessing Line Charts on Shoonya is simple and can be done in two ways.
- Stocks
If you want to view them for stocks, on the dashboard, click on Collections, then select Indices.
Further, you can also reach them directly by clicking on Indices under Volume Shockers or Most Active Today on the dashboard.
- Futures & Options
Open the FnO tab from the dashboard and select the index of your choice. The Line Chart for that index will appear instantly, giving you a clear view of its movement.
How Line Charts Help You Trade Smarter
Line Charts are very simple to understand and use.
Here’s why they’re helpful for every trader and investor:
- View Trends Easily: You don’t need to go through long tables of numbers. show you whether a stock is moving up, down, or sideways in one clean view.
- Spot Opportunities Faster: When you can see the direction of a stock at a glance, it becomes easier to decide when to enter or exit a trade.
- Track Stock Movements Over Time: Line Charts help you track how a stock has performed in the past 5 years versus today. This will allow you to make better choices for the future.
Step Into Smarter Trading with Shoonya
The all-new features are live and waiting for you.
- Android: Download the Shoonya Android app
- iOS: Get the Shoonya iOS app
- Web: Log in at Shoonya.com to explore
Disclaimer: Investments in the securities market are subject to market risks; read all the related documents carefully before investing.


