


September 18, 2025

September 10, 2025
July 3, 2025
January 10, 2025
15 Red Flags in Financial Statements: Identify Warning Signs Before It’s Too Late
Author
Shoonya Team
Ever wondered if the financial statements of a company are hiding something important?
It’s not always easy to tell at first glance.
Sarah is a new investor who excitedly invested her savings in a tech startup. The company’s flashy marketing caught her eye.
But where did she commit the biggest mistake?
She missed some subtle warnings in its financial statements.
A few months later, the company announced major losses, and Sarah realised she could have avoided this if she had looked closer.
Financial statements are crucial for making smart investment choices. They reveal a company’s health and potential for growth. These are helpful for investors like Sarah understand where to put their money. But these documents can be complex, and spotting issues isn’t always easy!
This is where understanding red flags in financial statements comes in.
Red flags are signs that something might be wrong. It could be declining revenue, high debt levels, or unusual accounting practices. By learning to recognise these warning signs, investors can make the right choices!
For instance, if Sarah had noticed the startup’s decreasing sales and increasing expenses, she might have hesitated before investing.
By understanding red flags in financial statements, you can avoid financial losses and choose companies with stronger foundations.
It’s important to note that there is no universal method for detecting red flags in a company. However, there are some common financial statement red flags that you can learn to avoid.
Let us introduce them to you!
Importance of Financial Statement Analysis: Your Investment Toolkit
If you are all new to the world of investing, you must know that understanding financial statements is essential. These documents provide insights into a company’s performance!
Let’s break down the three main financial statements:
- The Balance Sheet
- Income Statement
- Cash Flow Statement
Understanding Line Items
1. Balance Sheet
The Balance Sheet offers you an overview of a company’s financial position at a specific moment in time.
It’s divided into three main sections:
- Assets: This refers to what the company owns, such as cash, inventory, property, etc.
- Liabilities: It shows what the company owes, such as loans, unpaid bills, etc.
- Equity: The residual interest in the assets after deducting liabilities. This basically shows what shareholders own.
The Balance Sheet helps you see if a company has more assets than liabilities. This is the symbol of strong financial stability.
2. Income Statement:
The Income Statement shows the company’s profitability over a certain period (usually a quarter or year).
It includes:
- Revenue: The total income of the company from sales or services.
- Expenses: The costs incurred to generate revenue, including salaries, rent, and materials.
- Net Income: The profit or loss after all expenses are deducted from revenue.
This statement helps you understand how well a company is generating profit and managing its costs.
3. Cash Flow Statement:
The Cash Flow Statement tracks the flow of cash in and out of the company over a period.
It’s divided into three parts:
- Operating Activities: The amount of the cash generated or used in day-to-day business operations.
- Investing Activities: The amount of the cash spent on or received from buying and selling long-term assets.
- Financing Activities: Cash from borrowing or repaying loans and equity transactions.
This statement is crucial for assessing the company’s liquidity and how well it can cover its obligations.
Financial Statement Cheat Sheet
To simplify your overall financial statement analysis, here’s a quick reminder:
- You must compare financial statements over multiple periods to identify trends in revenue, profit margins, and debt levels.
- Financial ratios like the current ratio (current assets/current liabilities) are a must-use.
- You should always read the notes accompanying financial statements. These often contain important details and explanations.
Red Flags in Financial Statements – Warning Signs You Shouldn’t Ignore
Ignoring red flags in financial statements can result in substantial investment losses. Numbers can tell a compelling story, but they may also hide serious issues.
Here are some common financial statement red flags to watch out for:
Type of Red Flags in Finance
There are different categories of financial statement red flags that can help you identify potential problems.
Here are two main types to watch for:
- Warning Signs of Financial Instability: These indicate underlying issues that may affect a company’s financial health.
- Potential Accounting Manipulation: These suggest that a company might be altering its financial reporting to appear healthier than it is.
15 Red Flags in Financial Statements to Watch Out For
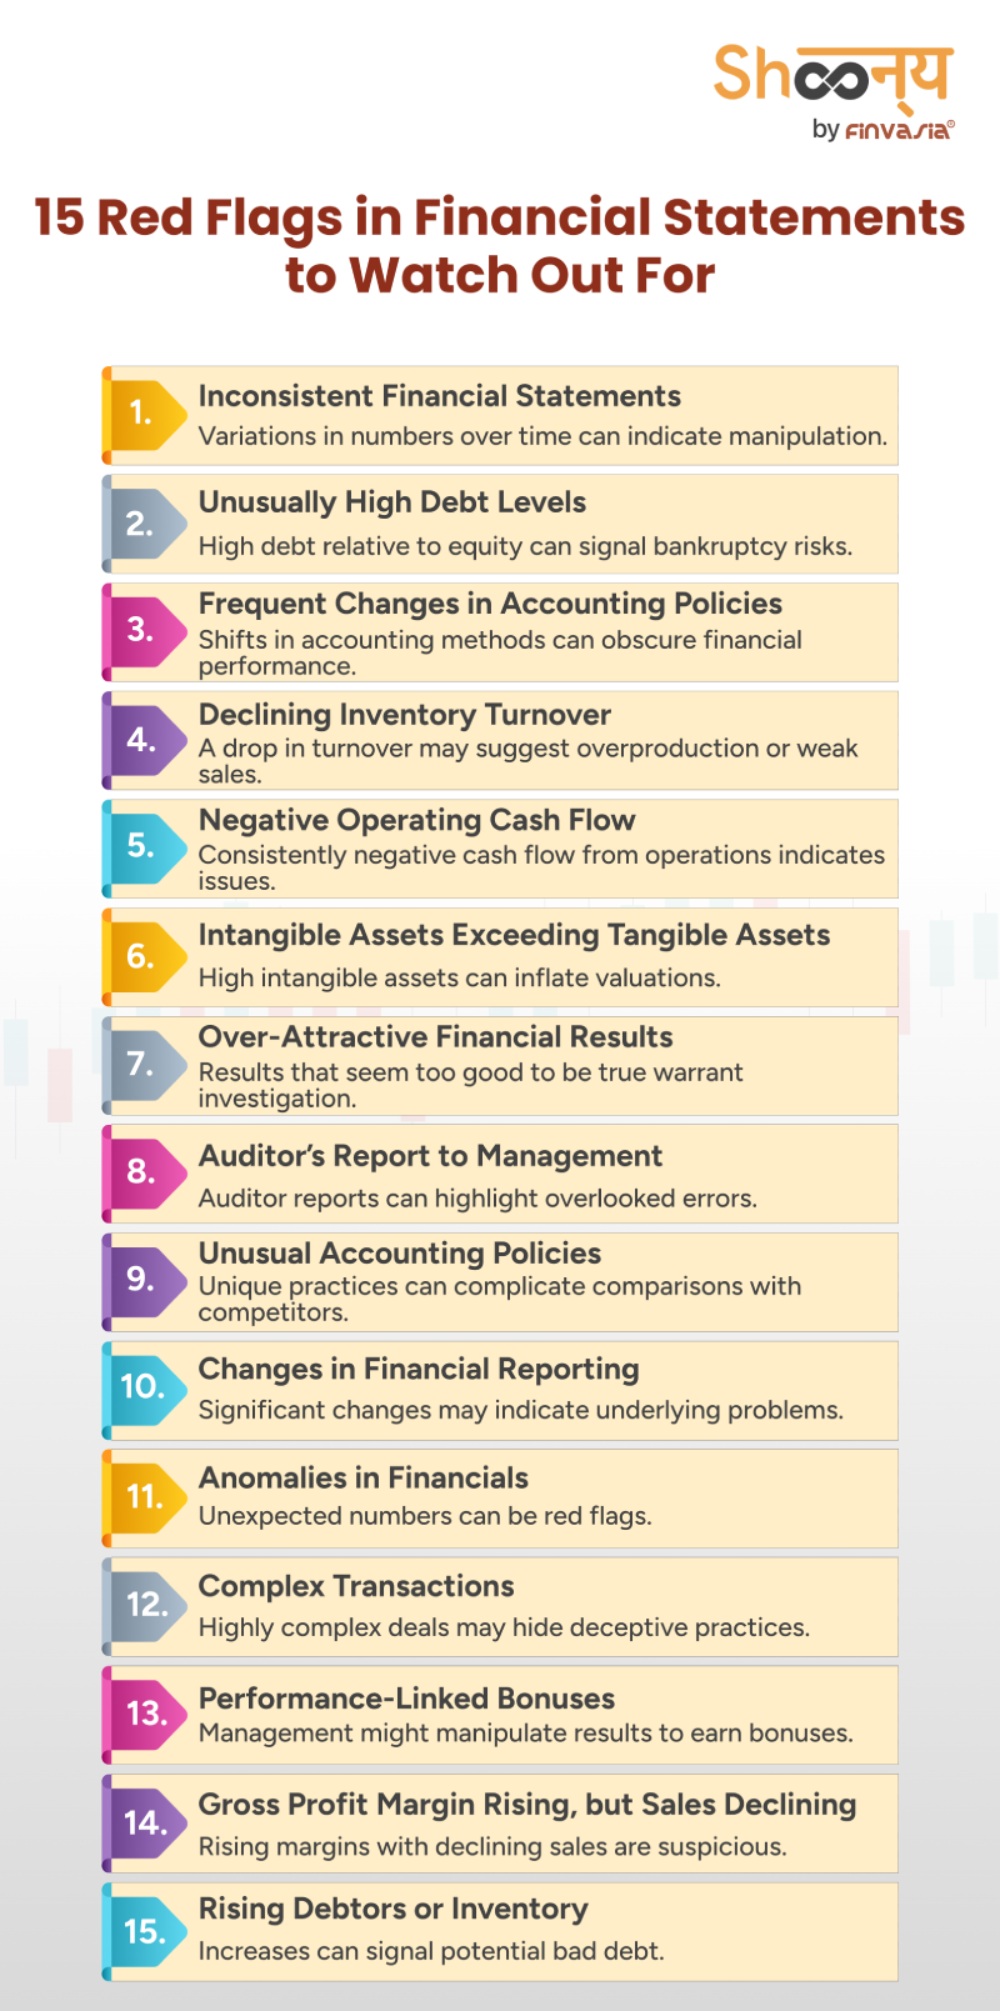
Here are some common financial statement red flags that you must be aware of!
| Red Flag | Description | Red Flags Examples |
| Inconsistent Financial Statements | Variations in reported numbers over time can indicate manipulation or errors. | A company’s revenue fluctuates dramatically between quarters without a clear reason. It is indeed a red flag example, and you must do a proper check. |
| Unusually High Debt Levels | High debt relative to equity can signal potential bankruptcy risks. | When a company has trouble paying interest, it gets a lower credit rating, and investors lose confidence. |
| Frequent Changes in Accounting Policies | Changes in accounting methods can cover financial performance. | A company frequently shifts its depreciation methods. This can make it difficult to assess true profitability. |
| Declining Inventory Turnover | A drop in inventory turnover may suggest overproduction or weak sales. | A business finds itself with excess unsold stock, leading to markdowns and reduced profits. |
| Negative Operating Cash Flow | Consistently negative cash flow from operations indicates underlying issues. | A company may show profits on paper but is unable to fund daily operations. It may be forced to seek emergency financing. |
| Intangible Assets Exceeding Tangible Assets | A high proportion of intangible assets can indicate inflated valuations. | A firm overestimates its brand value, leading to inflated earnings reports and investor disappointment. |
| Over-Attractive Financial Results | If financial results seem too good to be true, investigate for consistency or valid reasons. | A company reports sudden high profits without clear justification. |
| Auditor’s Report to Management | Auditor reports can highlight errors that management might overlook. | The auditor’s report lists several misstatements, which management dismisses. |
| Unusual Accounting Policies | Unusual accounting practices can make it hard to compare performance with competitors. | A firm uses uncommon methods to value inventory, leading to confusing financial comparisons with similar companies. |
| Changes in Financial Reporting | Significant changes in financial reporting can indicate underlying problems. | A company suddenly changes its debt-to-equity ratio, hinting at operational issues. |
| Anomalies in Financials | Unexpected numbers in financial statements can be red flags. | A firm shows high ‘Other Expenses’ or sudden increases in legal fees, which could mask deeper issues. |
| Complex Transactions | Highly complex transactions may hide deceptive practices. | A company engages in intricate deals with unclear economic benefits, suggesting potential deceit. |
| Performance-Linked Bonuses | Management may manipulate results to earn bonuses. | Executives focus on short-term gains to earn bonuses, compromising long-term company health. |
| Gross Profit Margin Rising, but Sales Declining | An increasing profit margin with declining sales is suspicious. | A firm shows higher profit margins while sales drop, indicating potential cost-cutting at the expense of long-term growth. |
| Rising Debtors or Inventory | Increases in debt or inventory can signal potential bad debt. | A company’s inventory piles up without corresponding sales, hinting at overproduction and potential losses. |
Beyond the Numbers: Red Flags in Finance
When you are evaluating a company, it’s crucial to look beyond the numbers.
Qualitative factors, which may not be reflected in financial statements, can provide you with important information!
1. Management Turnover and Internal Controls
Take a look at this red flag example.
For instance, if a CEO resigns after a short tenure, it could be a sign of deeper issues within the organisation. Strong internal controls are necessary to ensure financial accuracy. Weak controls can lead to errors, fraud, and financial mismanagement.
Frequent changes in management can indicate instability within a company.
However, this red flag in finance may not be immediately apparent in the financial statements but can have long-term detrimental effects.
2. Frequent Accounting Changes or Restatements
If a company regularly changes its accounting policies, it is indeed a red flag in finance. These actions may be attempts by the company to manipulate financial results or hide underlying problems.
Let us say a company changes its revenue recognition policy multiple times within a few years. This could mean that it is trying to inflate revenue figures to appear more profitable.
3. Issues with Corporate Governance and Legal Disputes
Strong corporate governance is important.
Issues such as conflicts of interest or ethical violations can severely damage a company’s reputation.
Red flag example– a company involved in many lawsuits might have to pay large legal fees and fines, which can reduce profits and harm its reputation.
4. Dependence on a Single Supplier or Customer
Red flag example– If a company generates a significant portion of its revenue from a single customer or relies on a single supplier, this can lead to supply chain disruptions if the supplier faces any issues.
Importance of Combining Quantitative and Qualitative Analysis
To fully understand a company’s health, it’s important to look at both the numbers (financial statements) and other factors (like management quality and governance practices). This combined approach helps spot potential problems and make better investment decisions.
For example, while financial ratios and trends show a quick view of how a company is doing, other factors give more context and detail.
An investor who looks at both the numbers and these other aspects can see the full picture and make smarter investment choices.
Taking Action: Invest Wisely
Knowing where to find financial statements and how to analyse them is crucial for every investor!
Where to Find Financial Statements
You can find financial statements in the investor relations section of a company’s website. As with SEBI, every public company must file its financial reports. You can access these filings online through databases through the BSE/NSE websites.
Basic Financial Statement Analysis Tools
1. Financial Ratios
Financial ratios can help you understand complex financial data!
Here are some of the key ratios that you must check:
- Current Ratio: It measures a company’s ability to cover short-term liabilities with short-term assets.
A higher ratio indicates better liquidity.
- Debt-to-Equity Ratio: This indicates the proportion of debt and equity used to finance the assets of the company.
A high ratio suggests higher financial risk.
- Return on Equity (ROE): It shows how effectively management is using shareholders’ equity to generate profit.
Higher ROE indicates more efficient use of equity.
2. Comparison with Industry Benchmarks
Comparing a company’s financial ratios with industry benchmarks can provide context.
For instance, if a company’s profit margins are extremely lower than the industry average, it may indicate inefficiencies.
On the other hand, if a company’s ROE is higher than that of its competitors, it suggests better management effectiveness.
3. When to Consult a Financial Advisor
If analysing financial statements and spotting red flags feels too difficult, think about getting professional help. A financial advisor can give expert insights and help you create a strong investment plan. They can also give personalised advice based on your financial goals and how much risk you can handle.
Conclusion
In conclusion, spotting red flags in financial statements is crucial for making smart investment choices. These warning signs, like inconsistent numbers or high debt, can help you avoid companies that might be in trouble. Remember, financial statements reveal a lot about a company’s health, but they can also be tricky to read.
That’s why it’s important to keep learning and being resourceful in your investment research. The more you know, the better decisions you can make!
FAQs| Red Flags in Financial Statements
A red flag in finance is a warning sign that something might be wrong with a company’s financial health. It indicates potential issues that investors should pay attention to.
A red flag on a Profit and Loss (P&L) statement could be signs like declining profit margins or expenses that don’t match up with revenue.
Financial red flags for companies can include things like rising debt levels, shrinking revenues, and irregular cash flows.
Red flag indicators are warning signs that suggest possible risks or fraudulent activities. They are often used in finance and compliance to highlight areas that need further investigation.
An example of a red flag is when a company consistently misses its earnings targets. This could indicate that there are underlying financial issues.
In auditing, a red flag refers to any unusual pattern or anomaly that might suggest misconduct or fraud. Auditors look for these signs to ensure everything is on board.
Common red flags in financial statements include inconsistent revenue figures, high levels of debt, and unexplained expenses. These can hint at financial instability.
In accounting, red is generally bad. It signifies losses or debt, while “black” indicates profit or positive financial health.
______________________________________________________________________________________
Disclaimer: Investments in the securities market are subject to market risks; read all the related documents carefully before investing.

Explore Our Offerings

Stocks
Trade equities across NSE and BSE with zero delivery charges. Invest, hold or sell with a seamless experience.


Future & Options
Execute complex strategies with simple tools and real-time data.

IPOs
Apply to the latest IPOs in just a few taps. Stay updated and capture opportunities as they open.