


September 18, 2025

September 10, 2025
July 3, 2025
January 10, 2025
SensAI by Shoonya – First-of-its-kind AI-powered Multi-agent Intelligence
Author
Shoonya Team
Let’s be honest, when you are trading or investing, you read dozens of news articles, scan charts, and check fundamentals, yet there is always some hesitation.
Even after hours of research, your decision to buy or sell often comes down to instinct. You sense the stock mood, but you are never sure if your feeling matches the data.
What if that instinct could be guided by intelligence? What if you could read the stock’s sentiment before making your next move?
That’s exactly what SensAI by Shoonya helps you do.
Meet SensAI: Your AI-Powered Stock Sentiment Analysis Tool
SensAI is an advanced stock analysis tool that gives you a complete 360° view of any stock by bringing together multiple types of analysis in one platform.
Behind SensAI lies the power of AI, machine learning (ML), and natural language processing (NLP). Together, these systems process massive volumes of structured and unstructured data from charts and company reports to real-time news.
AI Sentiment Prediction: AI gives each stock a clear sentiment label:
- Highly Positive: Strong outlook across most indicators.
- Positive: Generally favourable sentiment and trend.
- Neutral: Balanced outlook, no strong signal either way.
- Negative: Weak trend or cautious sentiment.
- Highly Negative: Strong downside or bearish signals.
SensAI brings structure to market chaos through these features:
- Overall Sentiment: Aggregates cross-domain intelligence of news, technical and fundamentals into a unified sentiment output.
- News Sentiment: Applies NLP and sentiment detection algorithms to process financial news, extract key signals, and quantify market tone for faster interpretation.
- Technical Sentiment: AI agents analyse SMA, EMA, RSI, Volume, and Price Movement metrics to identify trend strength, momentum shifts, and reversal patterns.
- Technical Indicators: Presents SMA, EMA, RSI, Volume, and Price data in dynamic chart formats for trend assessment and comparative analysis.
- Fundamental Sentiment: Utilises multi-year financial data models to evaluate revenue trajectories, profitability ratios, leverage, and liquidity indicators for a structured financial overview.
Benefits of SensAI
This stock sentiment analysis tool helps you save time, understand trends faster, and gain the financial clarity needed to act with confidence. Every insight is powered by data, refined by AI, and presented with simplicity.
Here’s how SensAI transforms your trading and investing experience:
- Comprehensive Sentiment View: Eliminate the need to switch between multiple apps, charts, or news sites. Everything you need is integrated into a single, easy-to-use dashboard.
- Market Awareness: Understand how news and market opinion influence your stocks or portfolio.
- Event-Based Insights: Track changes in sentiment after quarterly results, announcements, or major events.
- Control in Volatile Markets: Stay calm during market volatility with data-based clarity instead of guesswork.
- Smarter Strategy Building: Use AI-backed sentiment and trend data to plan long-term investment or trading strategies with greater confidence.
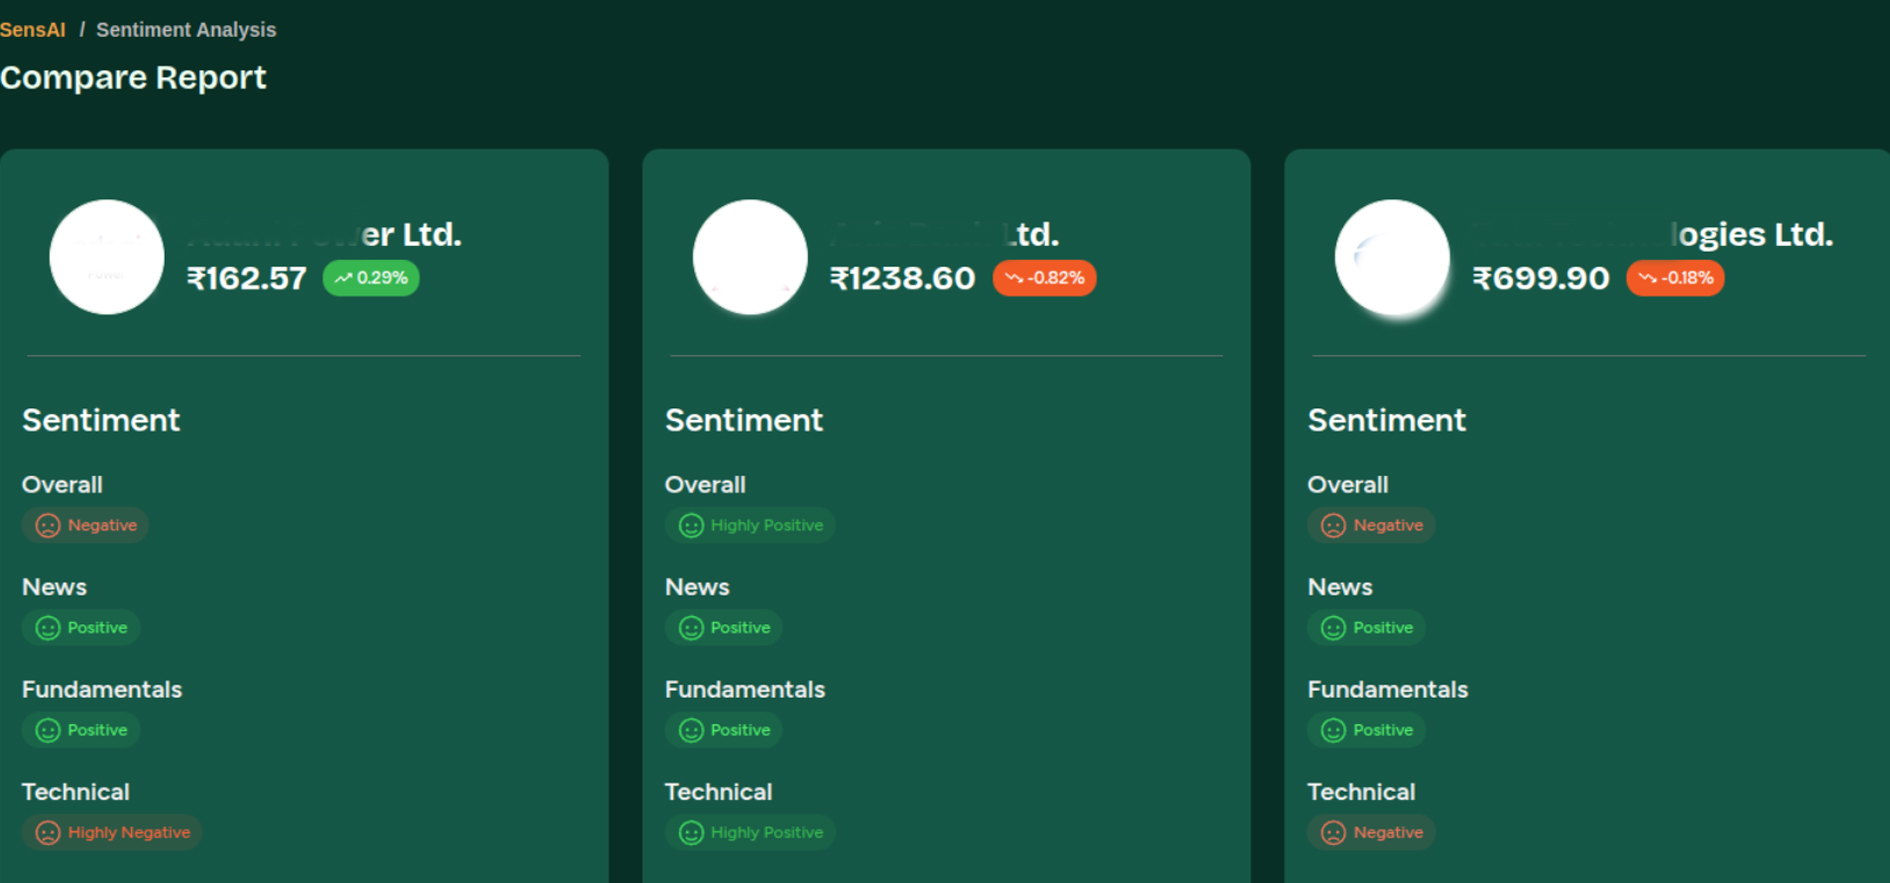
- Stock Comparison: You can also compare three stocks side-by-side, as shown in the screenshot below:
You can see this in action in the screenshot below, where three stocks are compared side by side with their sentiment breakdown.
Your Step-by-Step Guide to Using SensAI
SensAI makes stock sentiment analysis effortless.
It is available on both mobile and web platforms:
- Mobile: Available on the Shoonya Android App and the Shoonya iOS App.
- Web: Login at Beta Shoonya.com
Note: You need to update your app from the Play Store/App Store.
Once you’re in, SensAI helps you explore, analyse, and interpret real-time stock insights with complete clarity.
- Search the stock from the SensAI dashboard
After logging in, you will see the main dashboard.
Type the stock name of any NSE/BSE-listed stock in the search bar. Within seconds, SensAI generates a complete analysis for that stock.
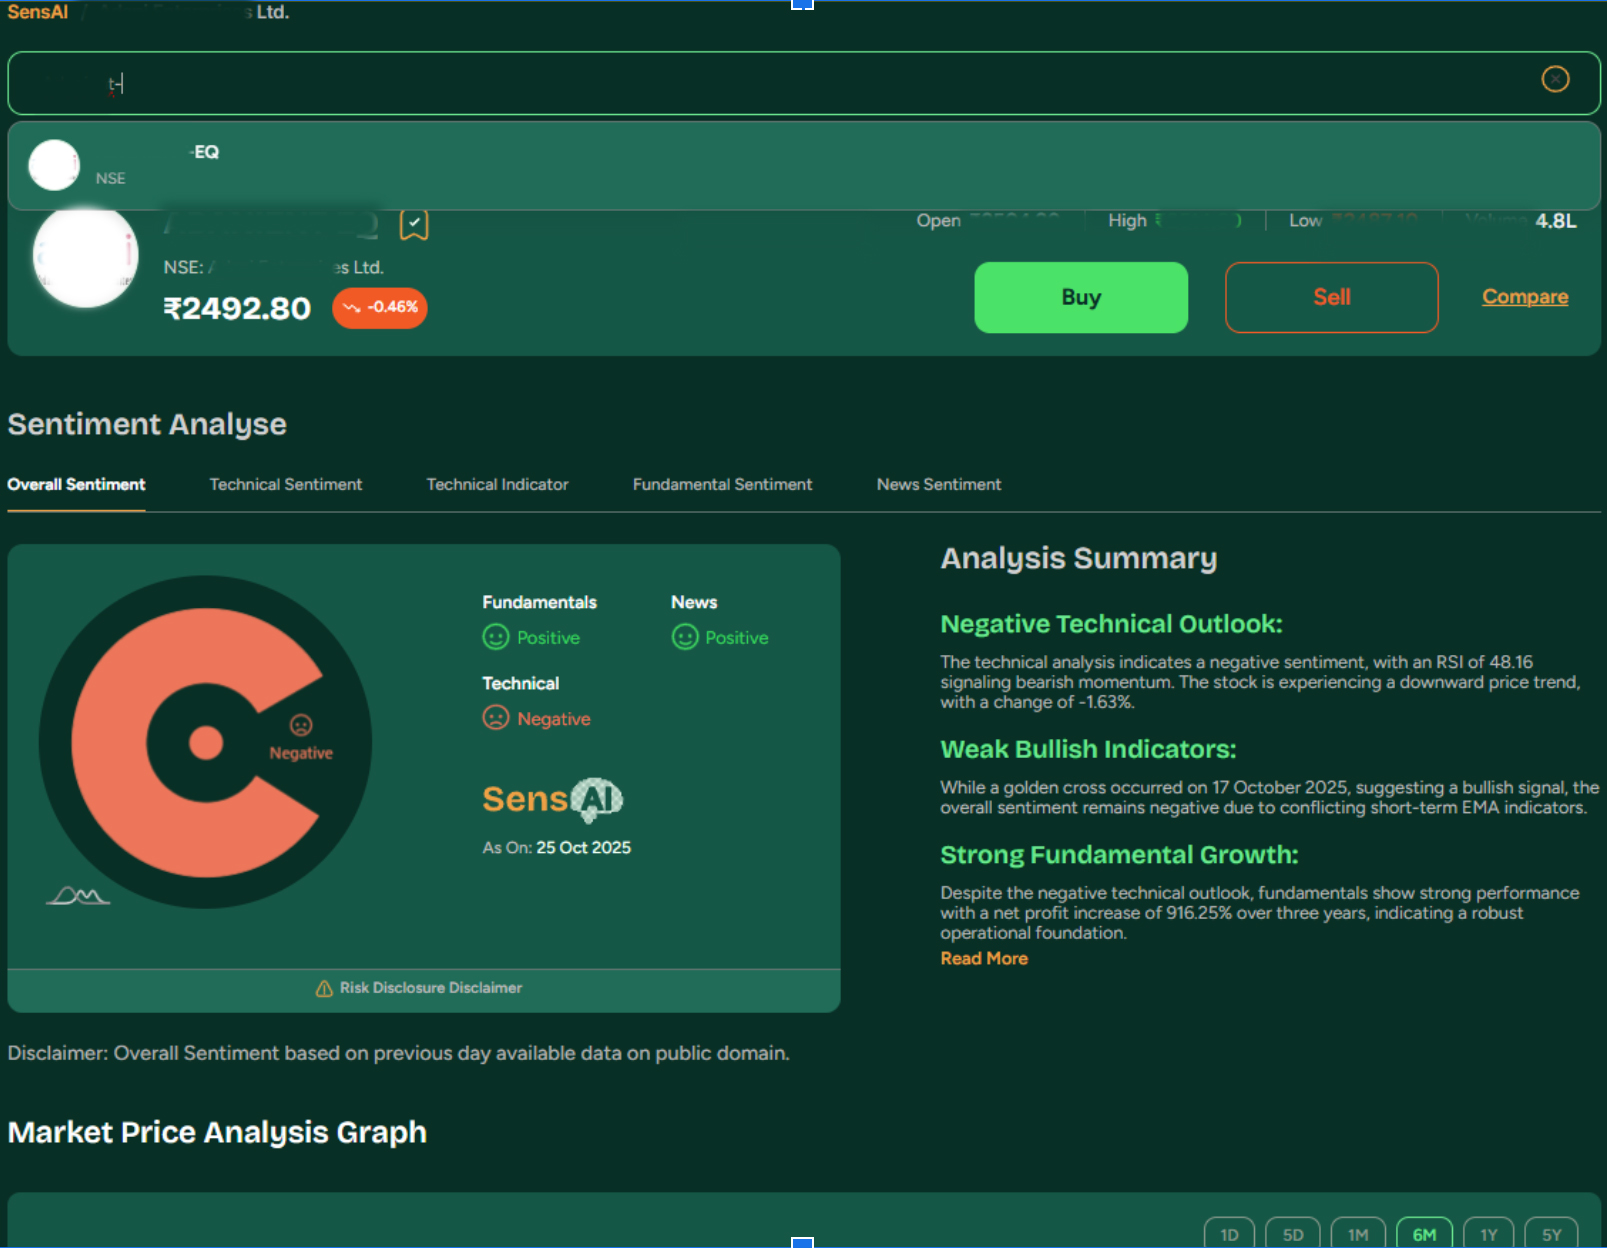
- Discover the Overall Stock Sentiment
You can also see a clear visual breakdown of its overall sentiment.
SensAI analyses multiple dimensions: technical trends, technical indicators, fundamental, and news sentiment and gives labels coloured as:
- Green: Highly Positive and Positive
- Red: Highly Negative and Negative
- Yellow: Neutral
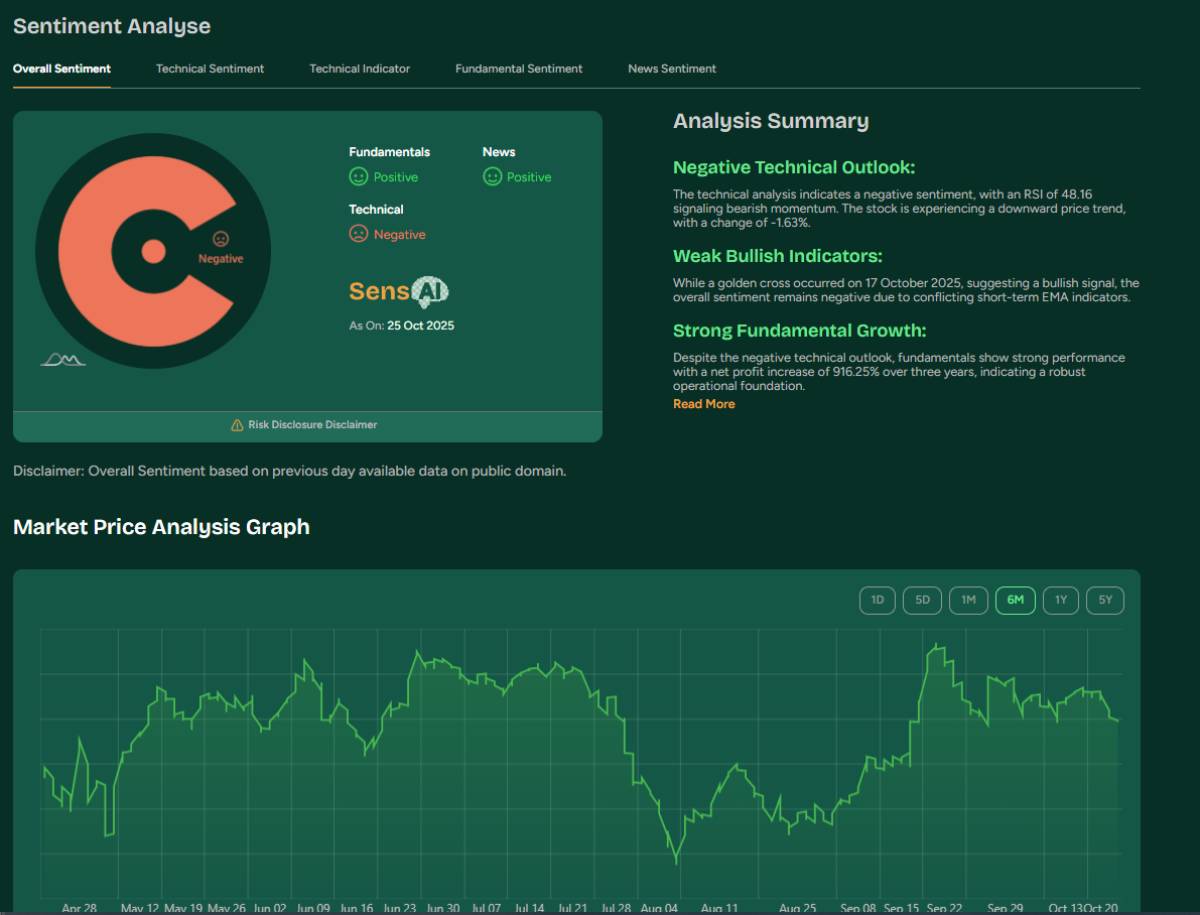
The Analysis Summary provides a concise explanation of why a stock’s sentiment is positive or negative.
Beneath the sentiment summary, you’ll also find a line chart showing the stock’s price movements over 1 day to the last 5 years.
- Get Technical, Fundamental & News Insights
SensAI also breaks down the analysis into four key areas, each with its own sentiment reading:
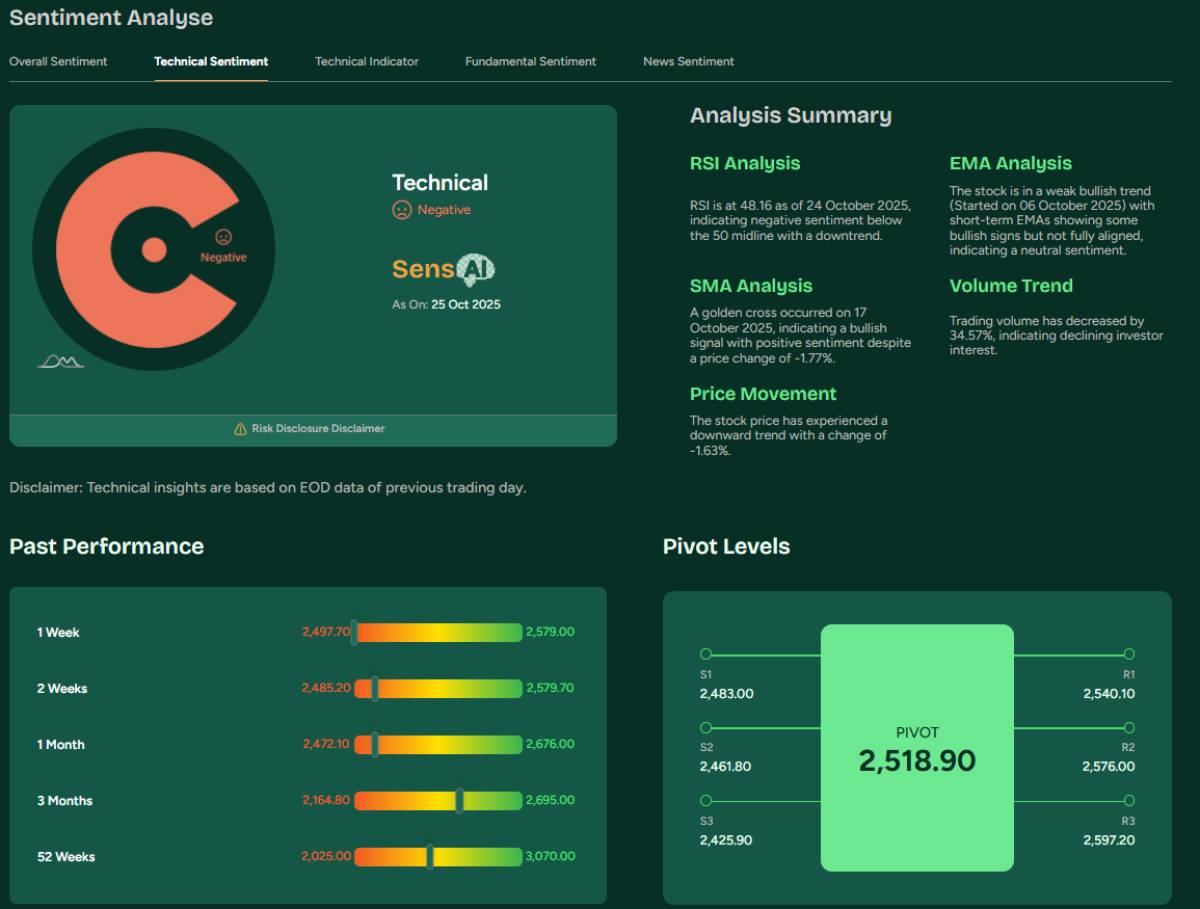
a. Technical Sentiment: SensAI gives you a clear snapshot of how a stock is performing based on price movements and trading indicators.
- It analyses multiple metrics, including RSI, SMA, EMA, volume trend, and price change, to help you understand whether the stock is showing bullish (upward) or bearish (downward) momentum.
- Not only this, it also provides 1-52 weeks of static past performance and pivot levels for investors seeking detailed information.
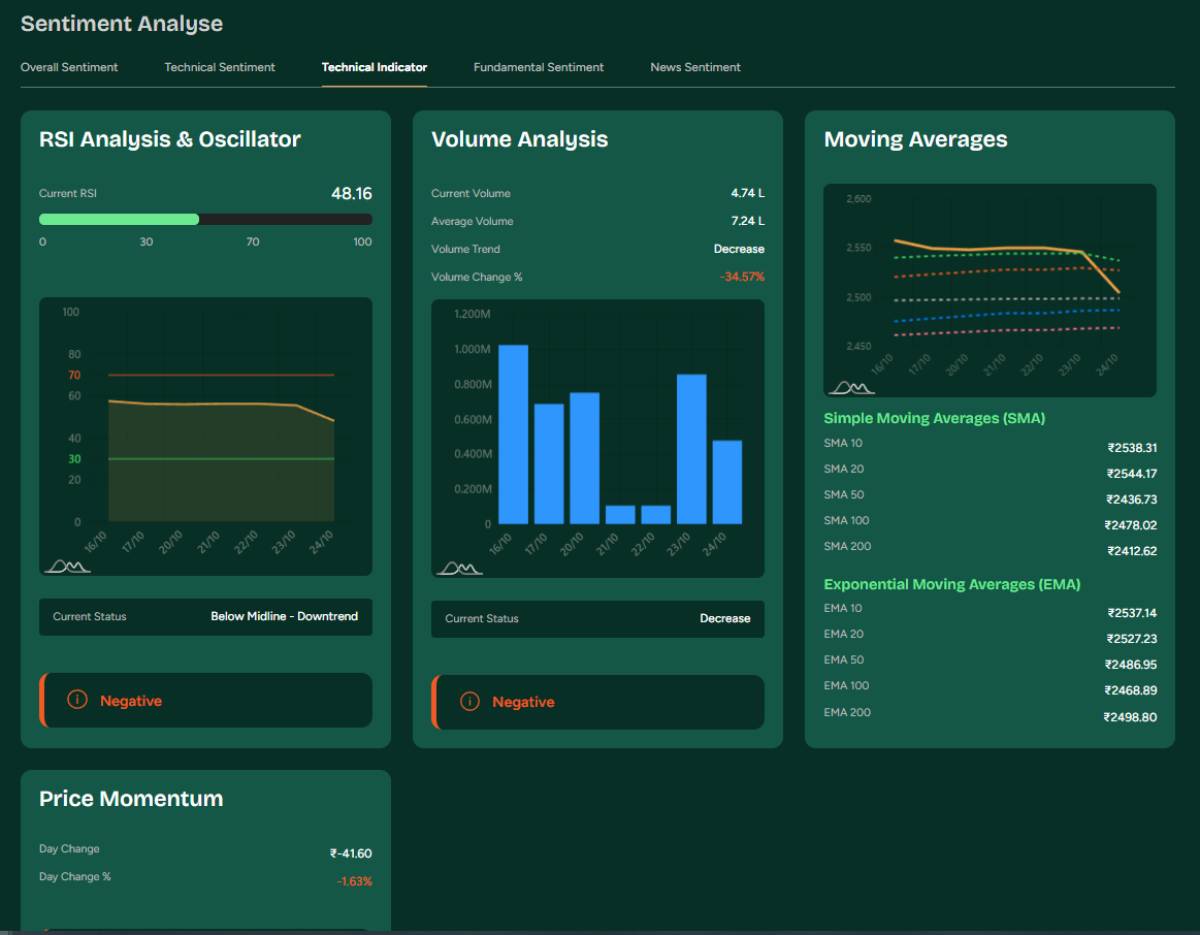
b. Technical Indicators: This section shows you RSI analysis & oscillator, volume analysis with visual bar charts, moving average crossovers, and price momentum.
Each metric includes its own sentiment tag, helping you see whether RSI signals are negative, volume is decreasing, or moving averages are aligning.
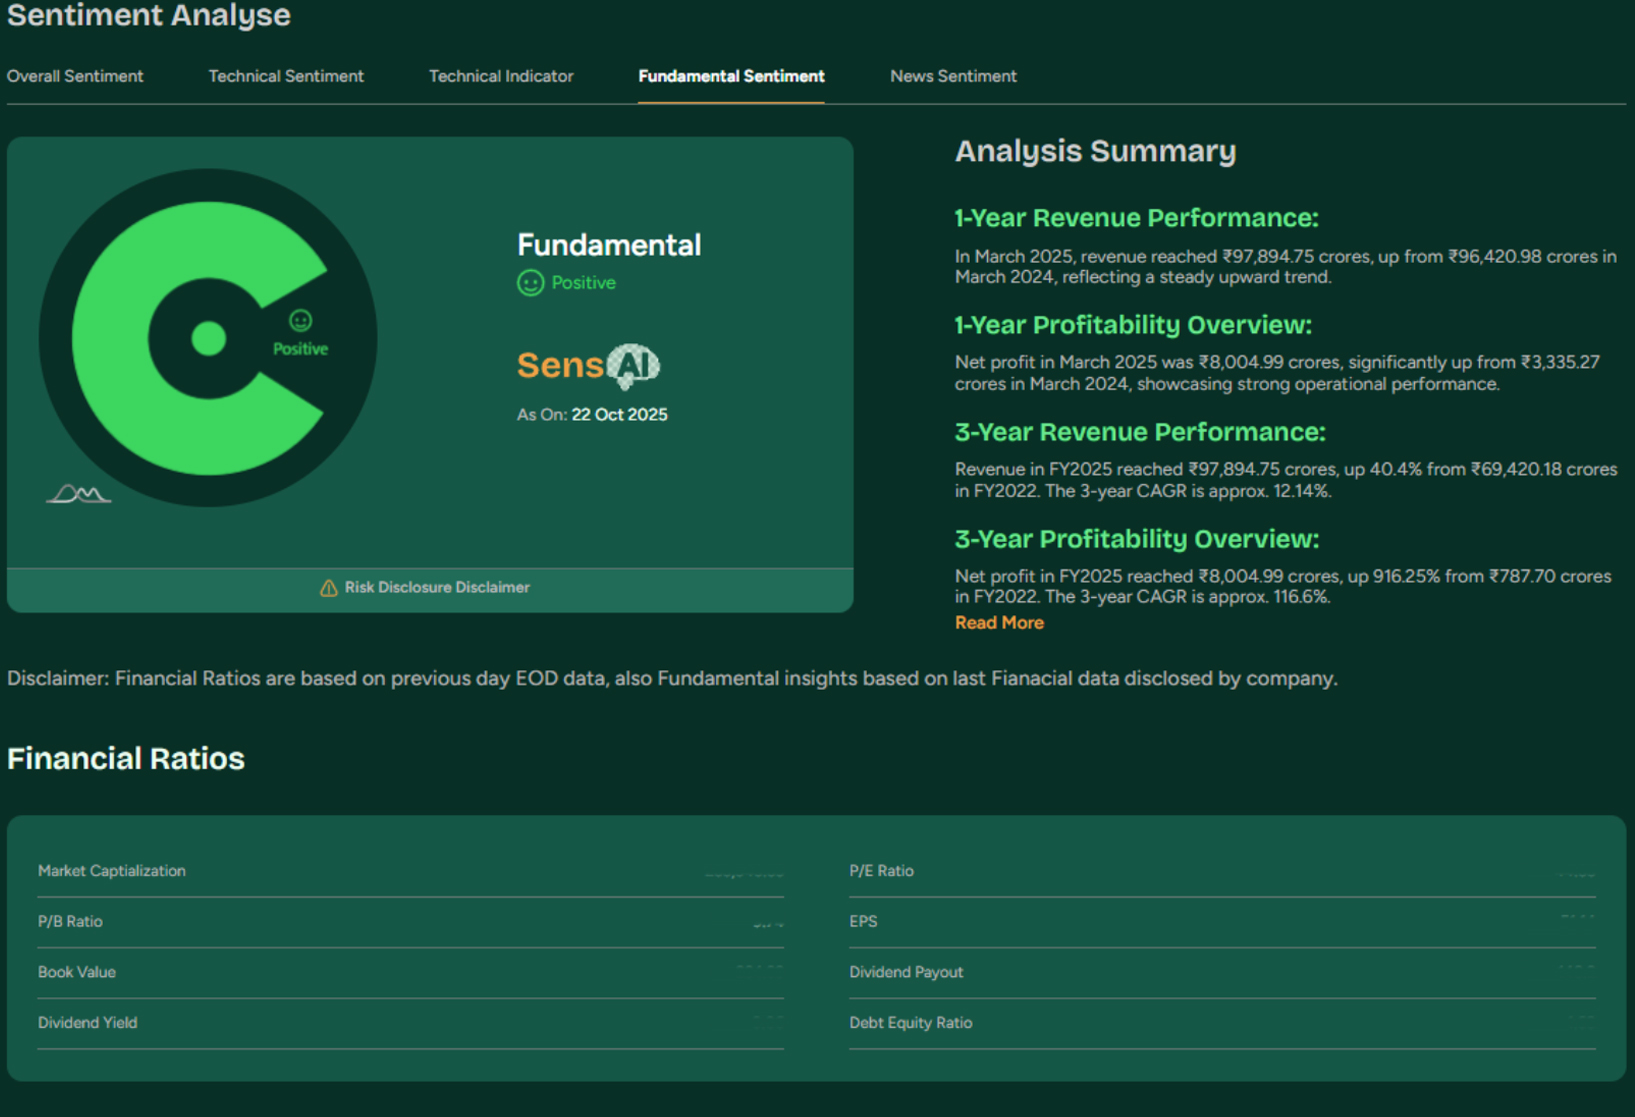
c. Fundamental Sentiment: This section in SensAI helps you understand a company’s financial strength and long-term stability.
- It tracks how a company’s revenue has grown or declined over the last five years. You can view profit and loss data across multiple years to see how margins, net profit, and earnings have evolved
- SensAI also displays essential financial ratios, including P/E, P/B, EPS, and dividend payout, as well as multi-year profit-and-loss tables and an outlook for investors looking for a detailed comparison of 5-year financial results.
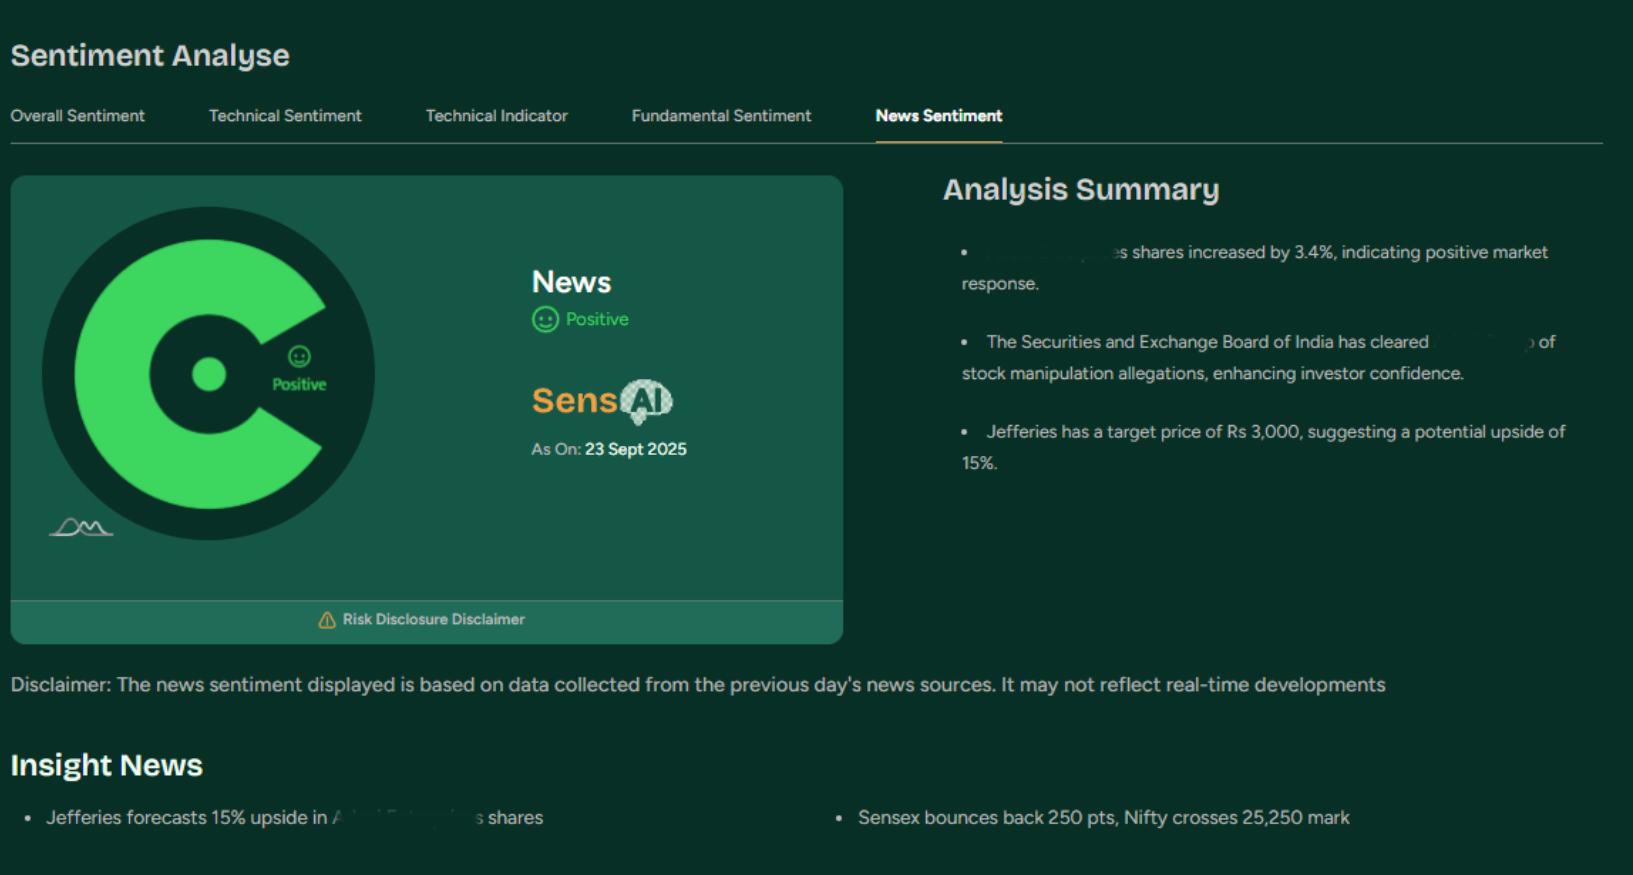
d. News Sentiment: SensAI scans recent news and announcements to determine whether the media narrative around the stock is positive, negative, or neutral.
You also get an Analysis Summary with key bullet points highlighting regulatory clearances, analyst upgrades, or company announcements and events, regulatory and compliance updates, and quarterly results.
Built for Real People, Real Decisions
In markets where news spreads faster than logic and sentiment shifts before charts can react, having a data-backed edge matters. SensAI gives you that edge. Instead of switching between news sites, charting platforms, and reports, it brings everything together in one clean view.
SensAI doesn’t replace your instinct. It strengthens it with intelligence.
This is not automation. It is adaptive intelligence in motion.
So before you take your next step, open SensAI. Let AI-powered sentiment show you what the numbers alone can’t reveal about the mood of the stock.
_________________________________________________________________________________________________________________
Disclaimer: Investments in the securities market are subject to market risks; read all the related documents carefully before investing.

Explore Our Offerings

Stocks
Trade equities across NSE and BSE with zero delivery charges. Invest, hold or sell with a seamless experience.


Future & Options
Execute complex strategies with simple tools and real-time data.

IPOs
Apply to the latest IPOs in just a few taps. Stay updated and capture opportunities as they open.