


September 18, 2025

September 10, 2025
July 3, 2025
January 10, 2025
How to Use Technical Indicators for Commodity Trading
Author
Shoonya Team
Commodity trading is a dynamic and challenging field that requires a comprehensive understanding of market trends and the ability to make informed decisions. Commodity Technical analysis plays a key role in this process, providing valuable insights into market behaviour and helping traders make predictions about future price movements. This article will examine the basics of technical indicators and how they can be used in commodity trading.
Understanding the Basics:
Technical analysis uses past market data, such as price and volume, to make predictions about future market behaviour. This approach assumes that market trends, driven by market participants buying and selling behaviour, tend to repeat themselves over time.
In commodity trading, technical analysis can help traders identify support and resistance levels, which are key areas where the price of a commodity is likely to face difficulty in rising or falling further. Technical analysis can also help traders identify chart patterns, such as head and shoulders or triangles, indicating a potential trend change.
Common Technical Indicators
There are a variety of technical indicators available for commodity traders, each with its own unique approach to analysing market data. Some of the most commonly used technical indicators used to analyse commodity markets are
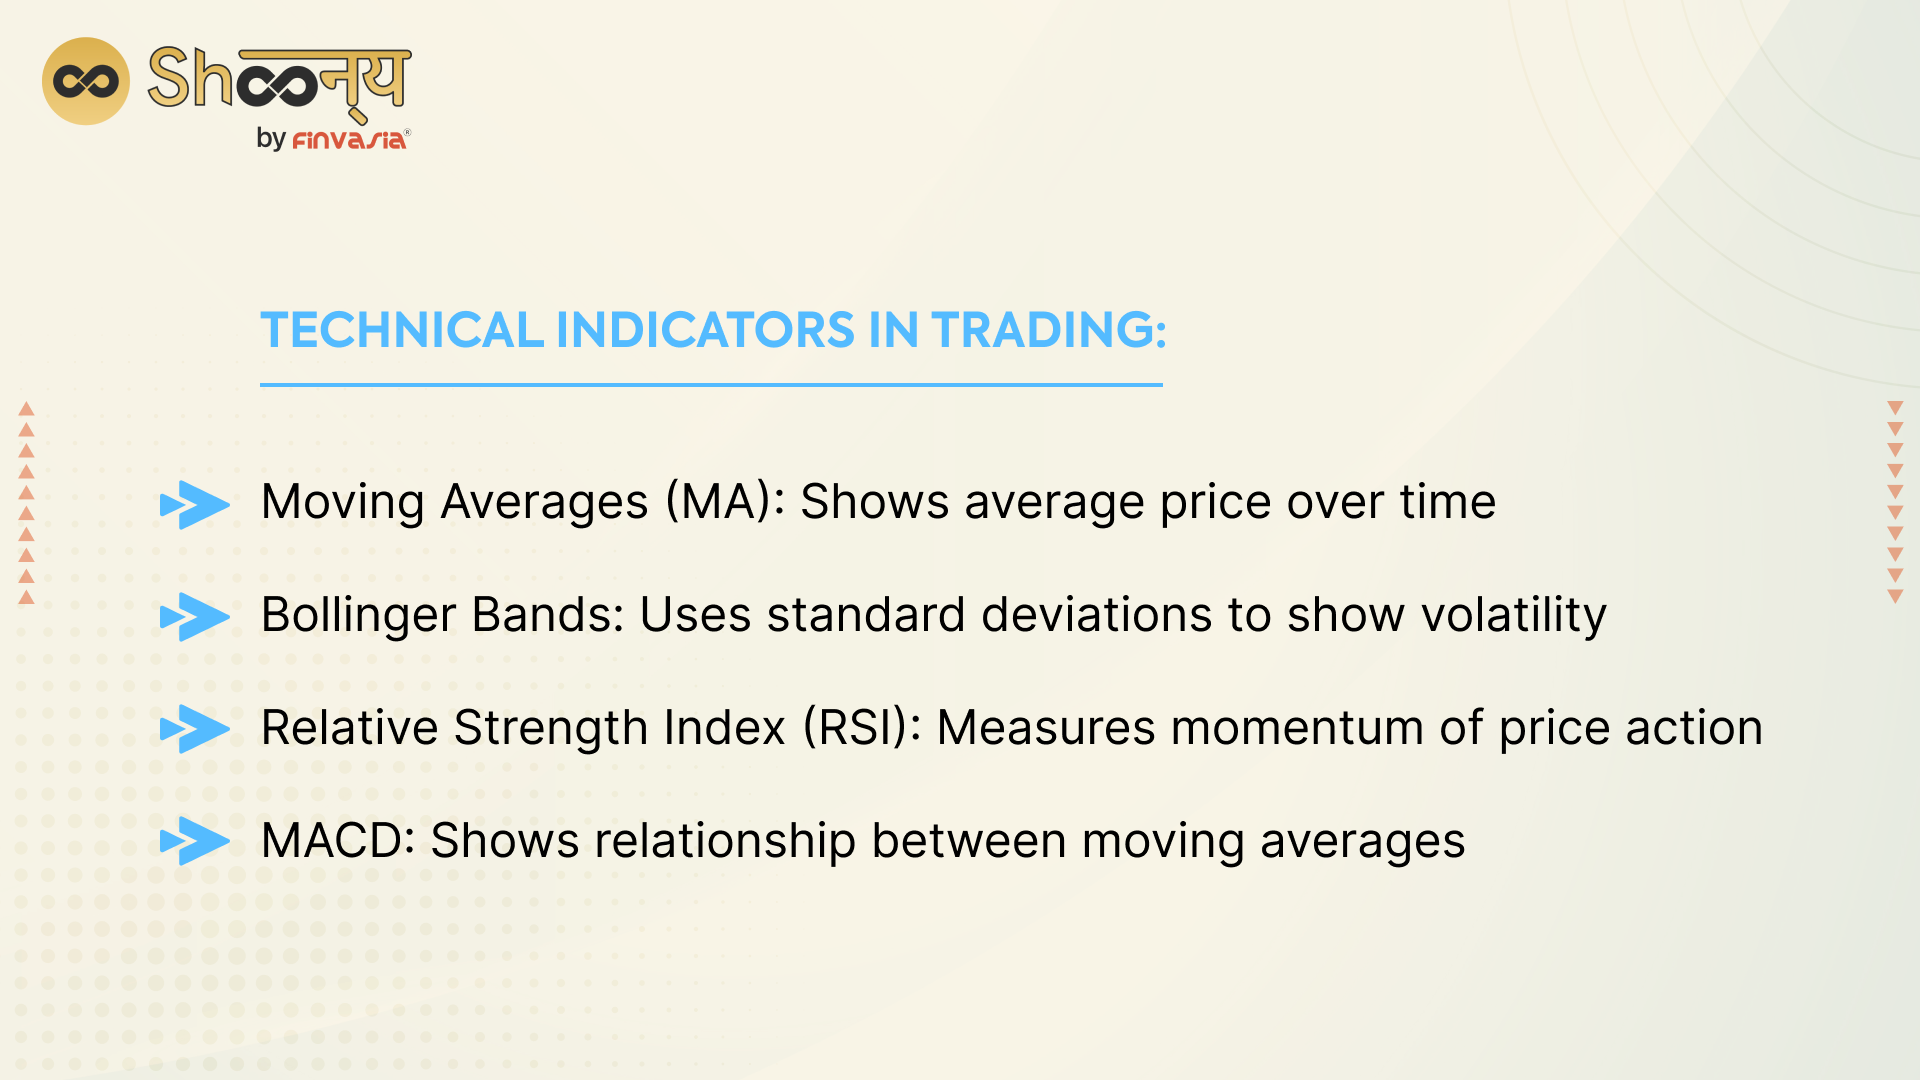
1. Moving Averages (MA) – A moving average is a widely used technical indicator that shows the average price over a set number of periods. This can help traders identify market trends and predict future price movements. For example, a trader may use a 50-day moving average to determine the overall trend of a commodity.
If the price is above the moving average, the trend is considered up, while if the price is below the moving average, the trend is considered down.
2. Bollinger Bands – Bollinger Bands is a volatility indicator that uses two standard deviations to plot an upper and lower band around a moving average. By analysing the distance between the bands and the price, traders can predict future price movements.
If the price is approaching the upper band, it may indicate that the market is overbought, while if the price is approaching the lower band, it may indicate that the market is oversold.
3. Relative Strength Index (RSI) – The RSI is a momentum indicator that measures the strength of a security’s price action. If the value is above 70, it indicates overbought conditions, while any values below 30 indicate oversold conditions. This can help traders make decisions about buying and selling based on market momentum.
For example, if the RSI is above 70, a trader may choose to sell, while if the RSI is below 30, a trader may choose to buy.
4. MACD (Moving Average Convergence Divergence) – The MACD is a trend-following momentum indicator that shows the relationship between two moving averages. By analysing the distance between the two moving averages, traders can make predictions about future price movements. For example, if the MACD is above the signal line, it may indicate a bullish trend, while if the MACD is below the signal line, it may indicate a bearish trend.
Conclusion:
Technical indicators can be an important tool for commodity traders, providing valuable insights into market trends and helping to make predictions about future price movements. Download Shoonya App now to have a premium trading experience with zero brokerage fees for a lifetime.

Explore Our Offerings

Stocks
Trade equities across NSE and BSE with zero delivery charges. Invest, hold or sell with a seamless experience.


Future & Options
Execute complex strategies with simple tools and real-time data.

IPOs
Apply to the latest IPOs in just a few taps. Stay updated and capture opportunities as they open.