


September 18, 2025

September 10, 2025
July 3, 2025
January 10, 2025
How to Use AI-Powered Signal-Based Analysis on Shoonya’s Mobile Application?
Author
Shoonya Team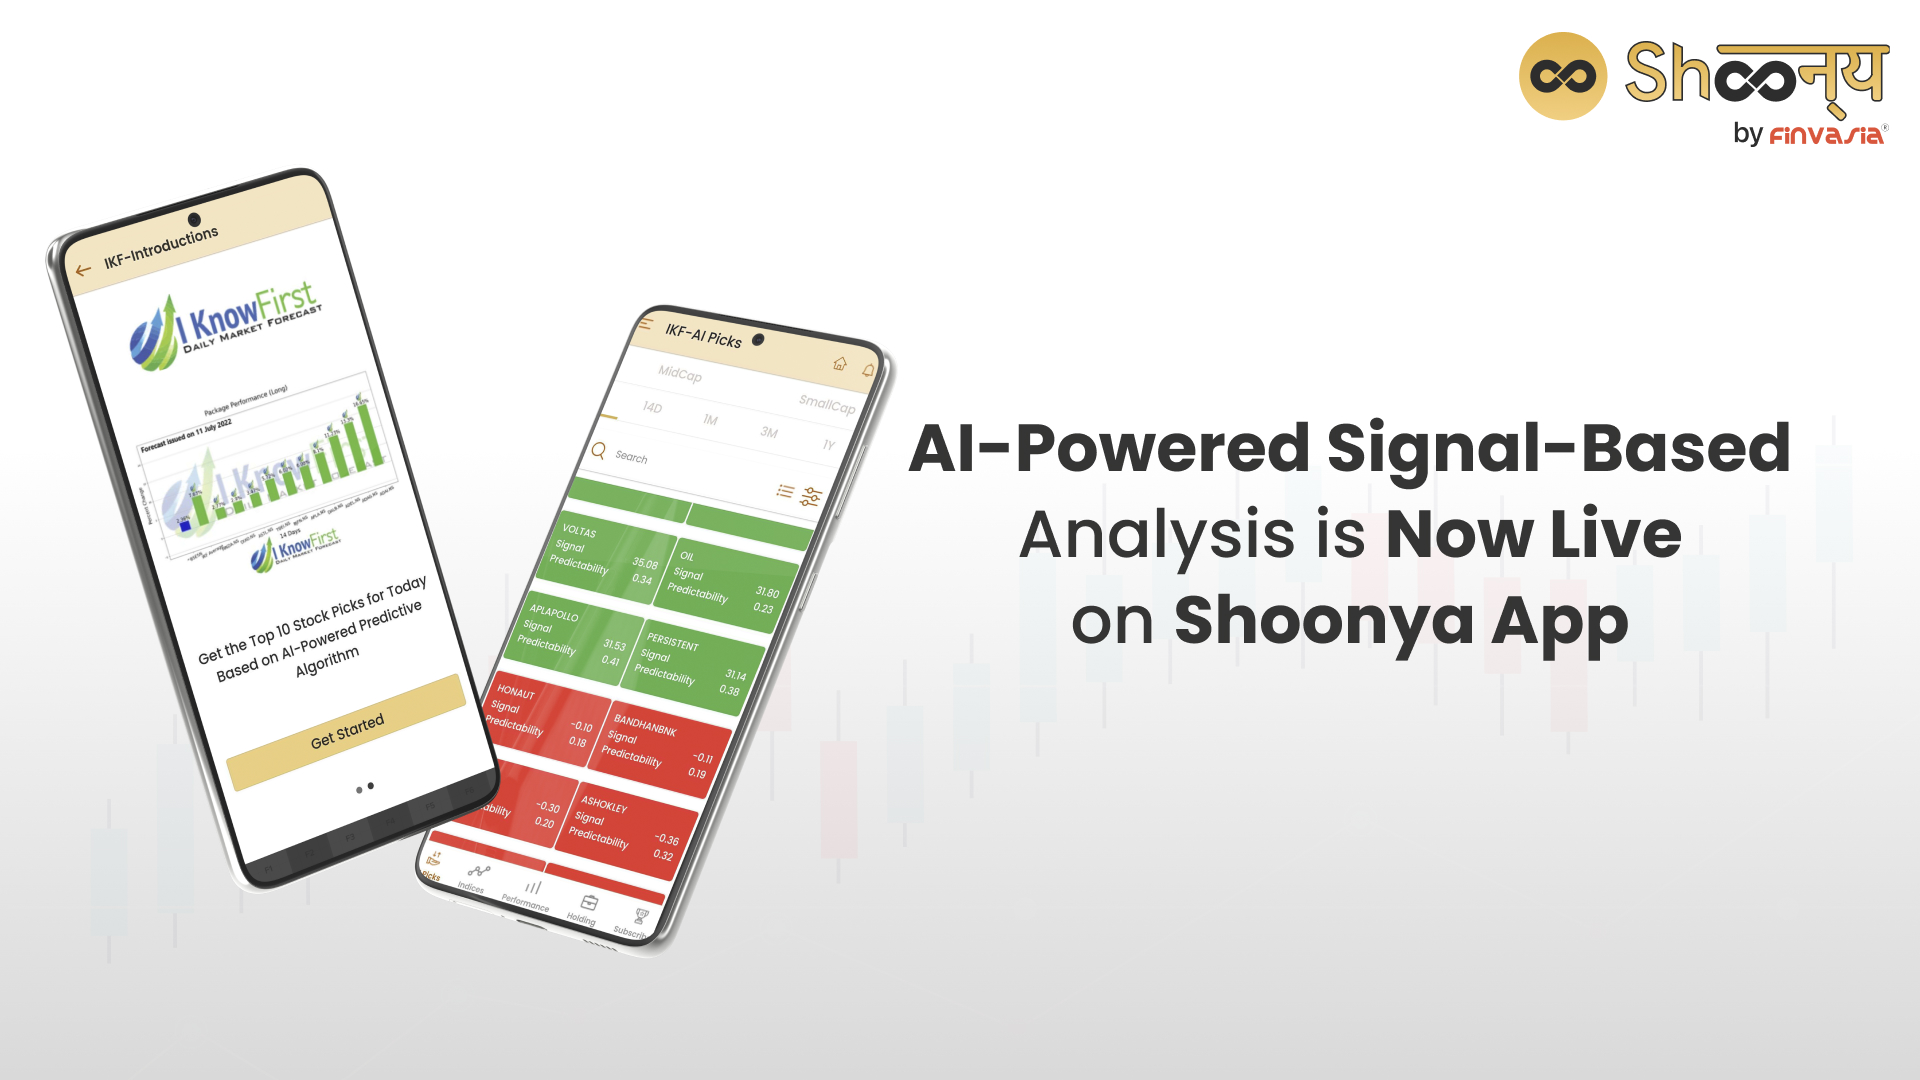
Enjoy an enhanced trading experience on the Shoonya app with AI-powered signal-based analysis.
Shoonya’s exclusive partnership with I Know First brings cutting-edge solutions to empower traders and investors. Shoonya users can now easily access detailed algorithmic signals, otherwise used only by advanced traders and financial entities. This upgrade empowers you to utilise these powerful tools and make well-informed decisions in your trading and investment activities. I Know First is now available on the Shoonya Mobile (only available for Android users) and Web (beta.shoonya.com).
Here are the unique benefits of Shoonya’s I Know First integration
1. Daily Top Stock Picks
I Know First predicts movements of up to 1500 Indian scrips and identifies the best investment opportunities on a daily basis for Shoonya customers. This feature is backed by extensive historical research to help you make your trades easily.
- The stock picks are categorised into three laps- Large Cap, Mid Cap, and Small Cap- 20 stock picks for each cap.
- Also, you can further check daily top 20 stock picks for each cap to predict your success with ten each for buy/sell in each category.
2. Colour-Coded Signals:
- AI-advanced predictive technology provides colour-coded signals to help you easily interpret market movements and make buy and sell trade decisions in a single click.
Dark green (BUY) and red (SELL) indicate strong signals, while light green and red denote weaker signals.
Suppose a stock is labelled with a dark green signal. In that case, it is likely to perform well in the near future. On the other hand, if the signal is light green or light red, it may not be a promising investment opportunity.
3. Instant Heatmaps:
- ‘I Know First’, via its predictive algorithm, helps you generate instant heatmaps for stock market predictions across six different time ranges, including 3D,7D,14D,1M,3M & 1Y periods.
Heatmaps provide a quick visual representation of the stock market trends and patterns, making it easy for traders to analyse and interpret market data effectively.
4. Performance Predictions with AI-Driven Market Percentage:
This feature lets you access the predictive return analysis of up to 1500 Indian scrips divided into large, mid, and small caps with return percentages offered for each category.
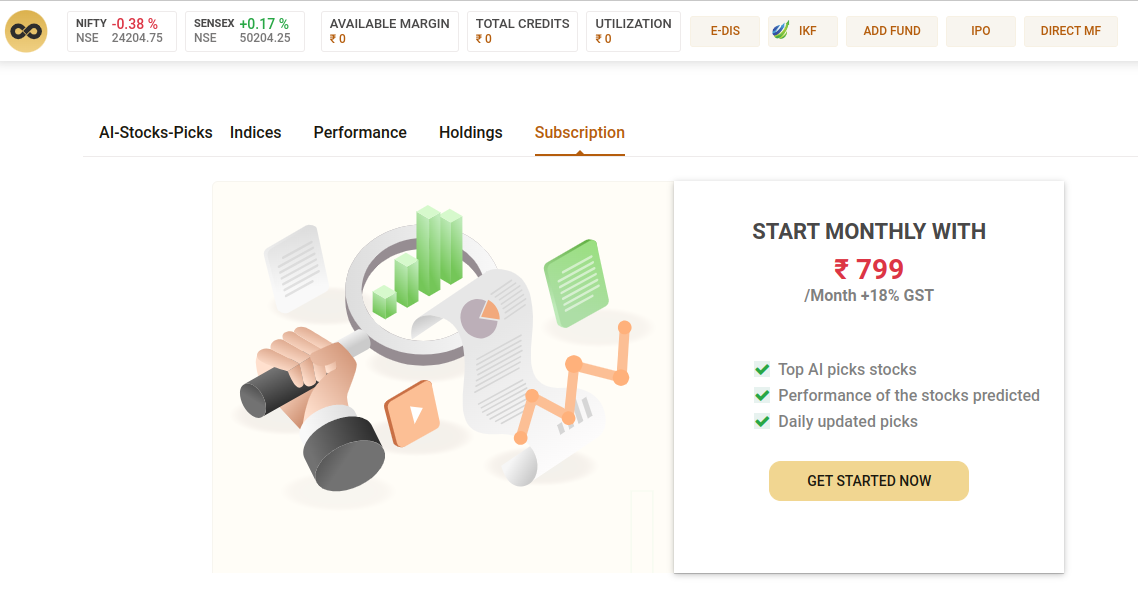
Subscription Plans
Our subscription plans are designed to make powerful AI-driven stock market trading accessible to all Shoonya traders.
Basic Monthly Plan
Get started with our introductory offer: Enjoy all the benefits for just ₹999 + 18%GST.
How to Use AI-Powered Signal-Based Analysis on Shoonya’s Mobile Application?
To use the latest predictive analysis feature on Shoonya’s mobile application, you need to follow these steps:
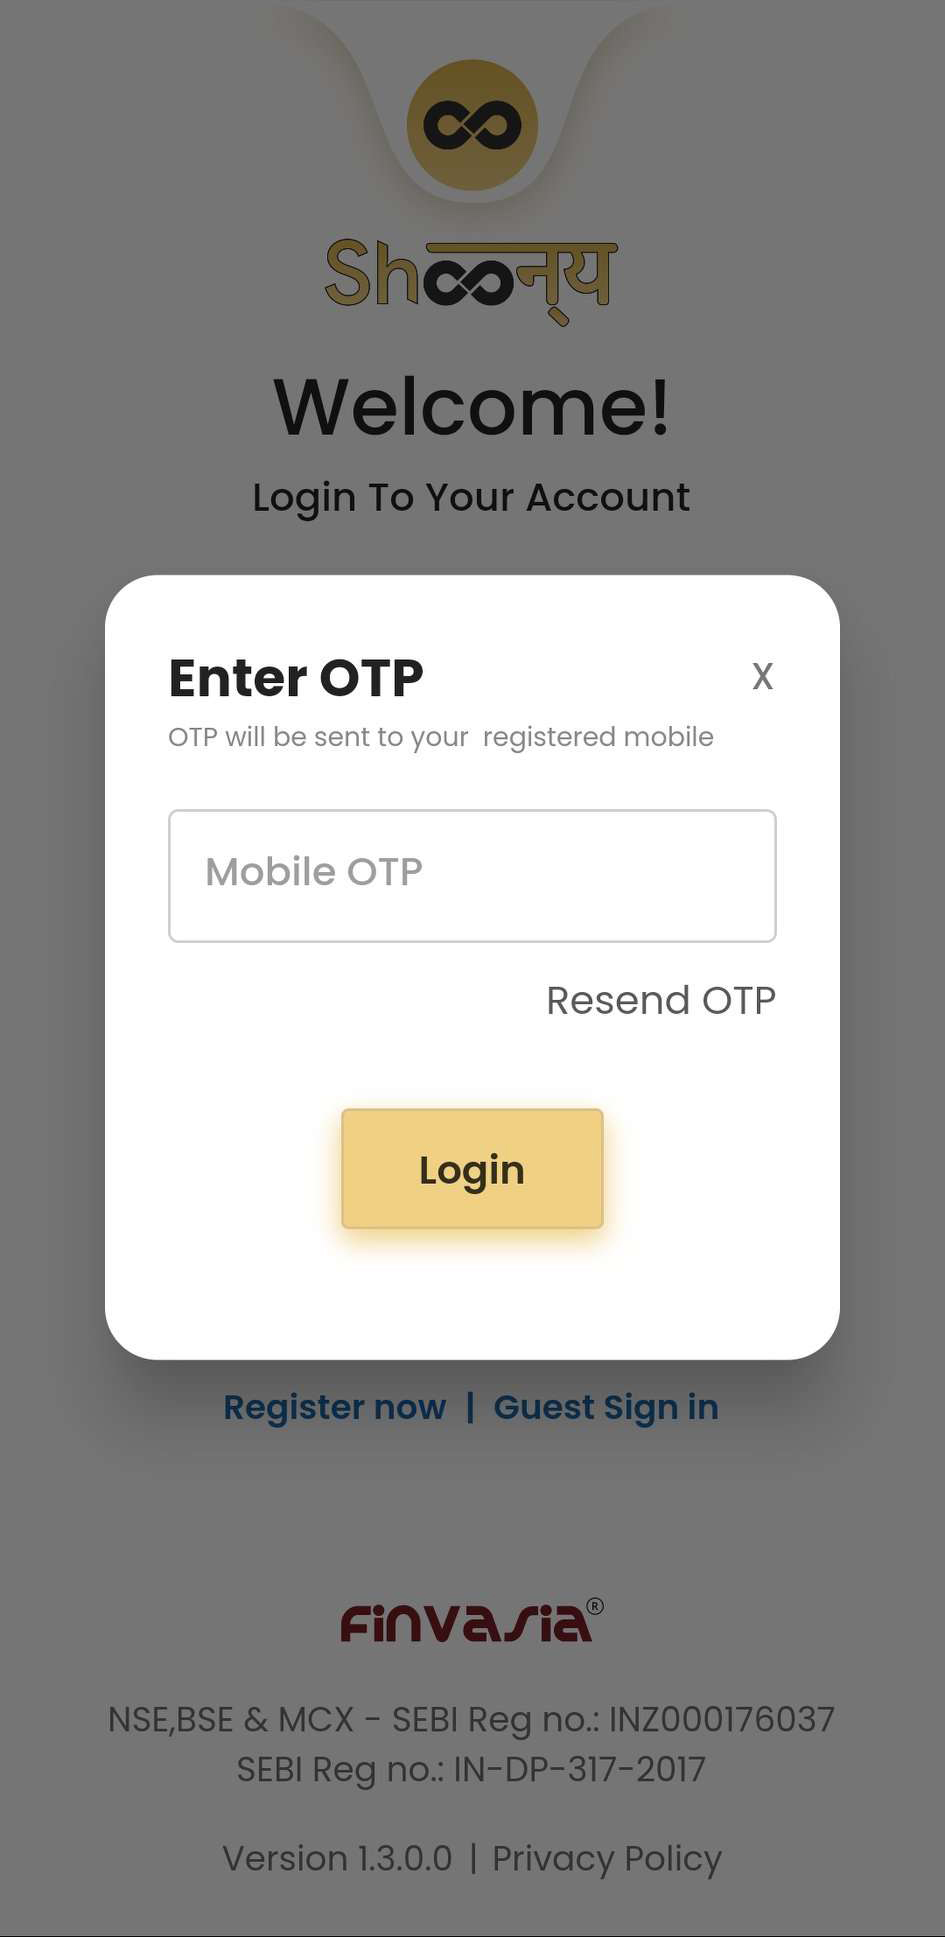
1. Log in to Shoonya’s mobile application using your email ID; either you can manually enter your email or “Sign in with Gmail” for Android. (Ref Image – 1)

2. Next, you will receive an OTP on your registered mobile number, Please fill the OTP to proceed. (Ref Image – 2)
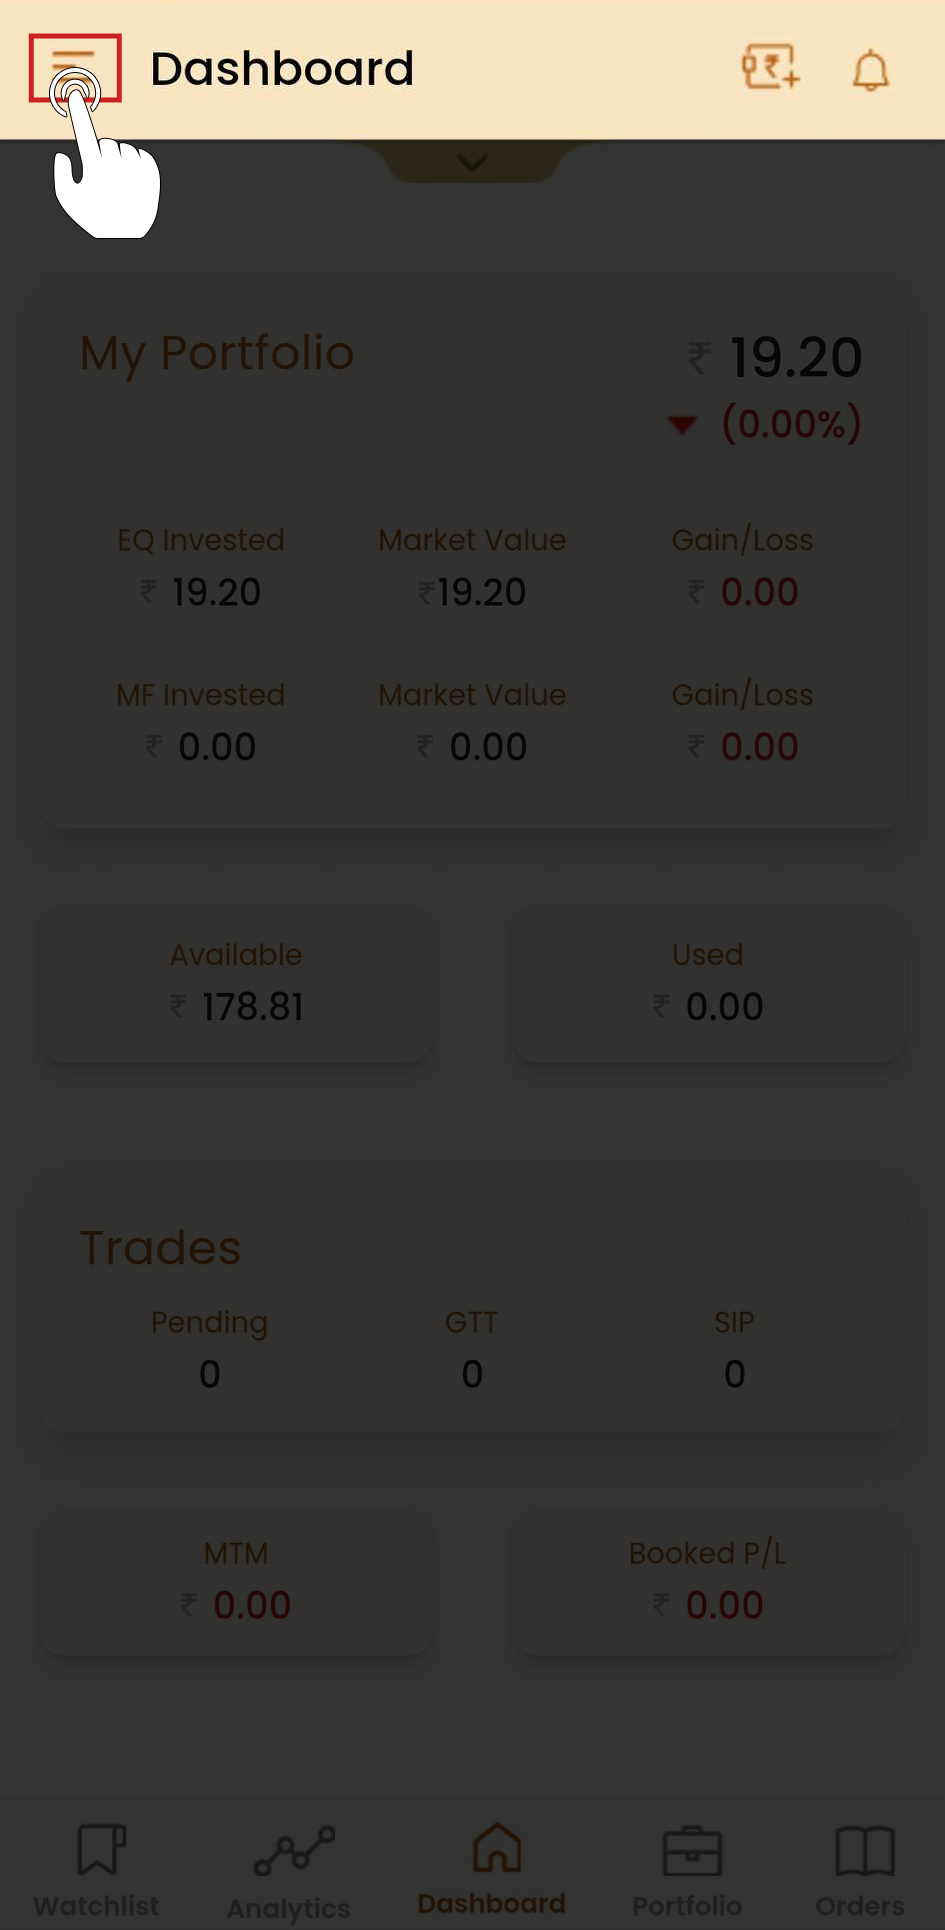
3. As you enter the dashboard page, you must click on the three lines visible on the top left side of the dashboard to open HUB. (Ref Image – 3)
4. Under the ‘Others’ section from the menu on the left side of the screen, click on IKF.
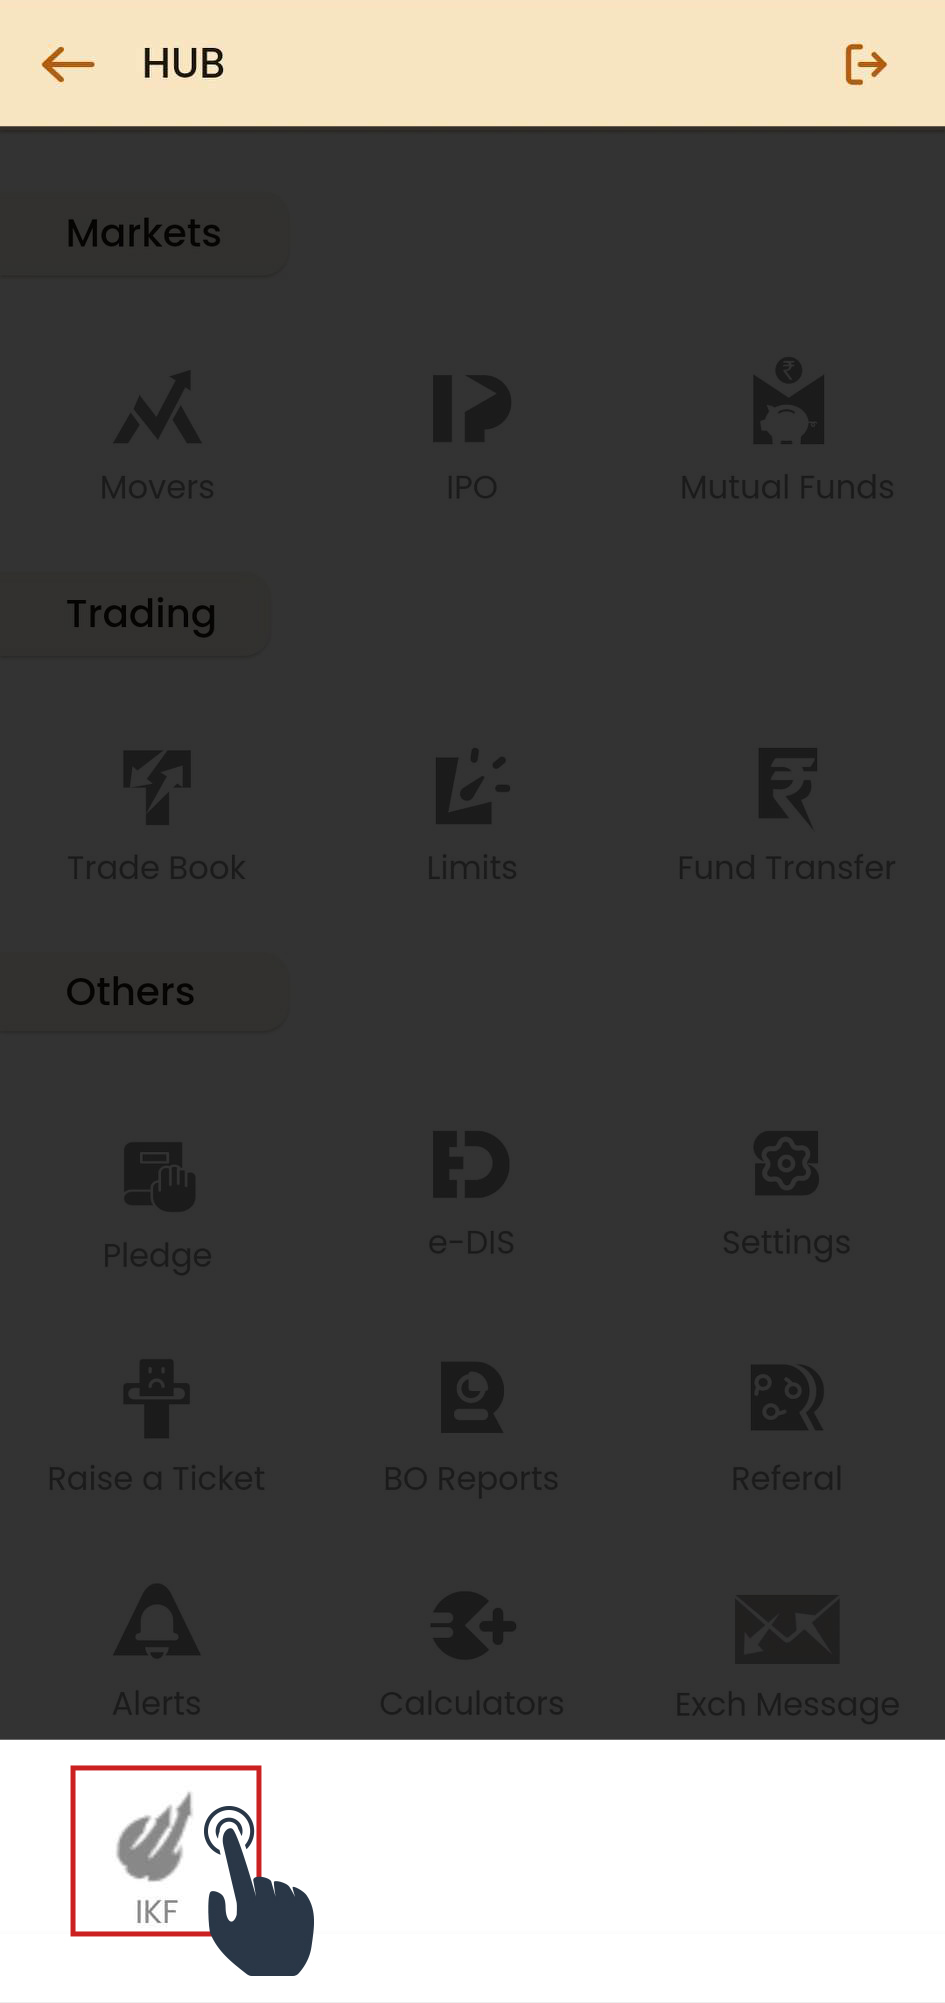
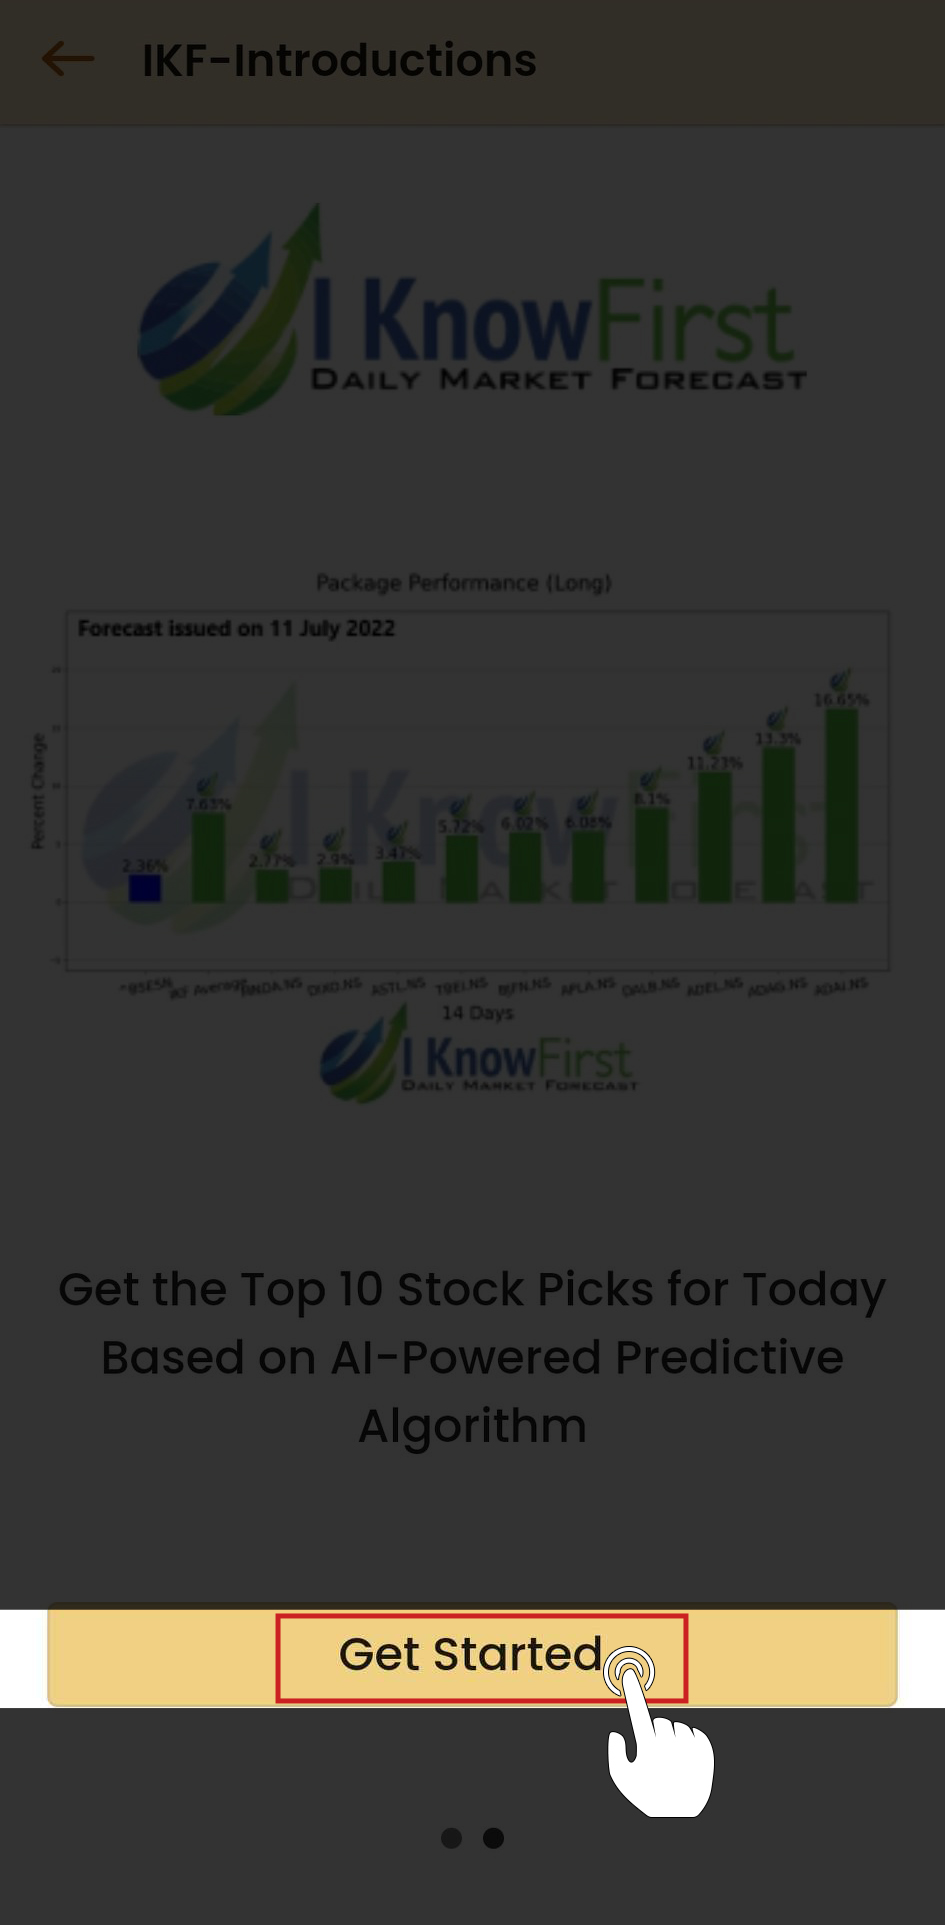
5. You will be directed to the ‘I Know First’ AI main screen. Click on ‘Get Started’ in the ‘I Know First’ AI main screen. (Ref Image – 5)
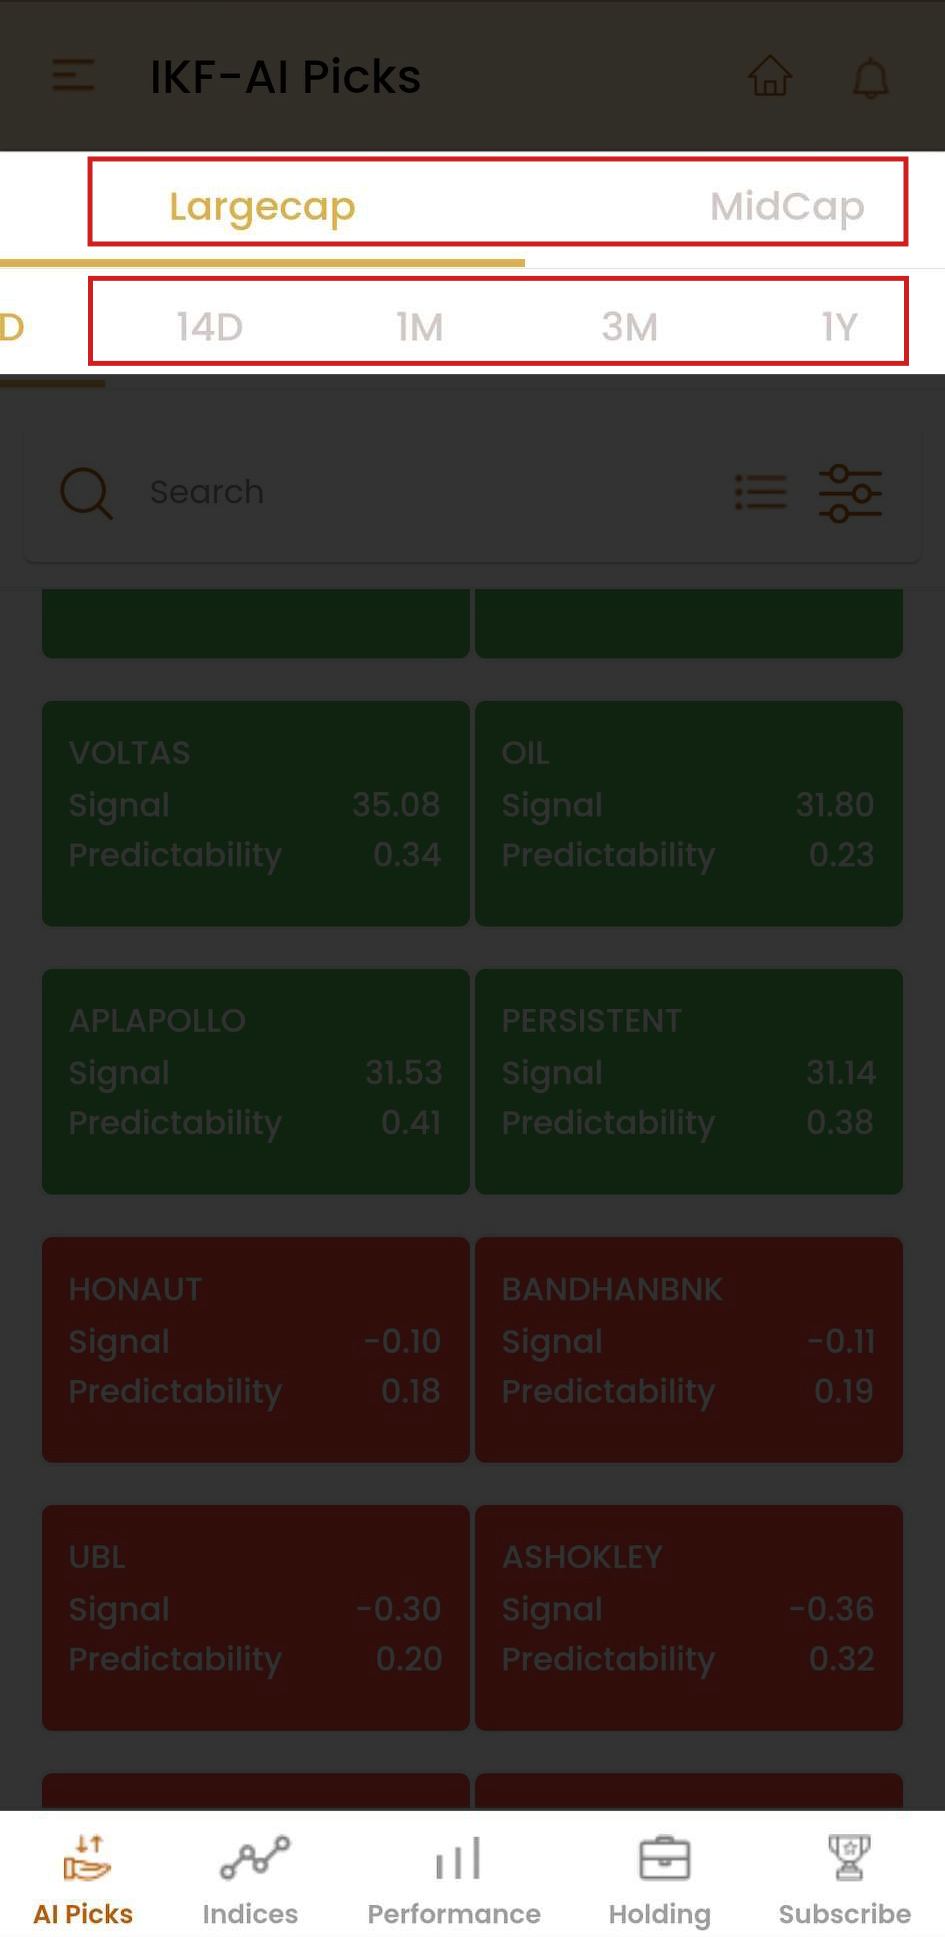
6. Now, as you enter the main ‘I Know First’ dashboard, you will see the first screen representing the red and green-marked stocks.
There will be different sectors to choose from, like large caps, mid-caps, and small caps, and different time frames as well, such as 3D, 7D, 14D, 1M, 3M, and 1Y. (Ref Image – 6)

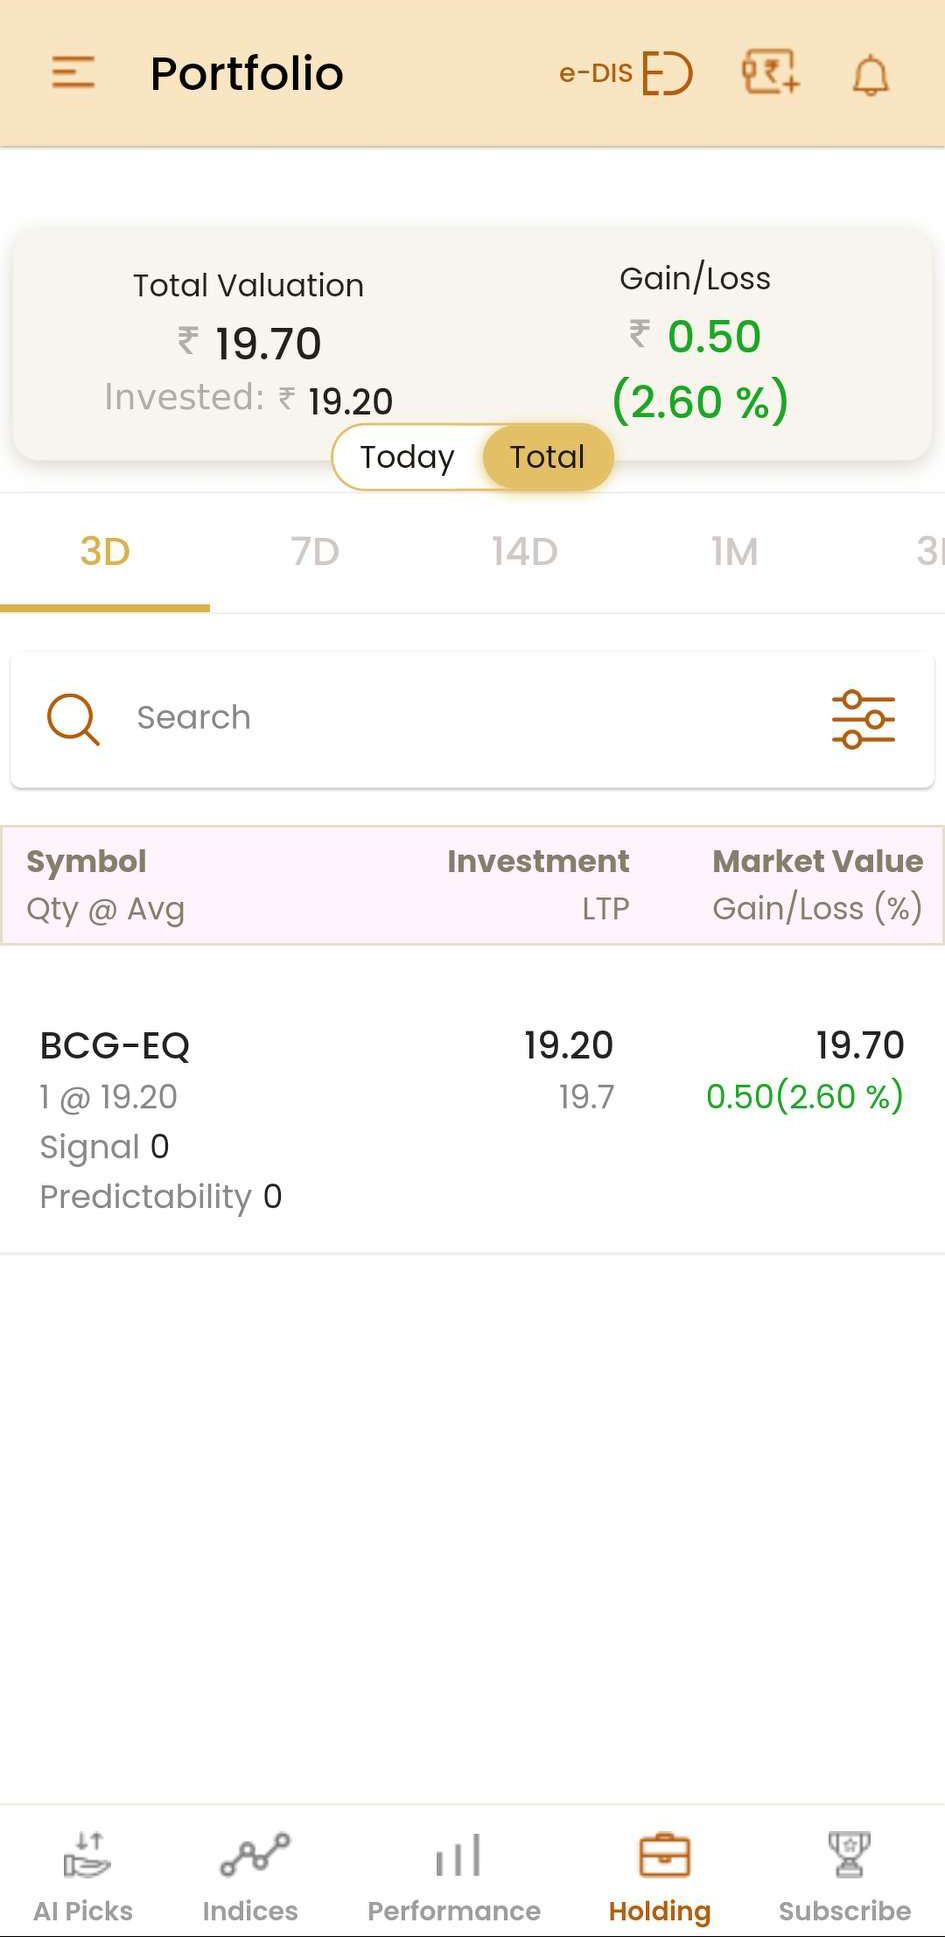
7. There are five tabs on the bottom of your screen – AI-Picks, Indices, Performance, Holding, and Subscription. Each of these tabs has a different purpose.
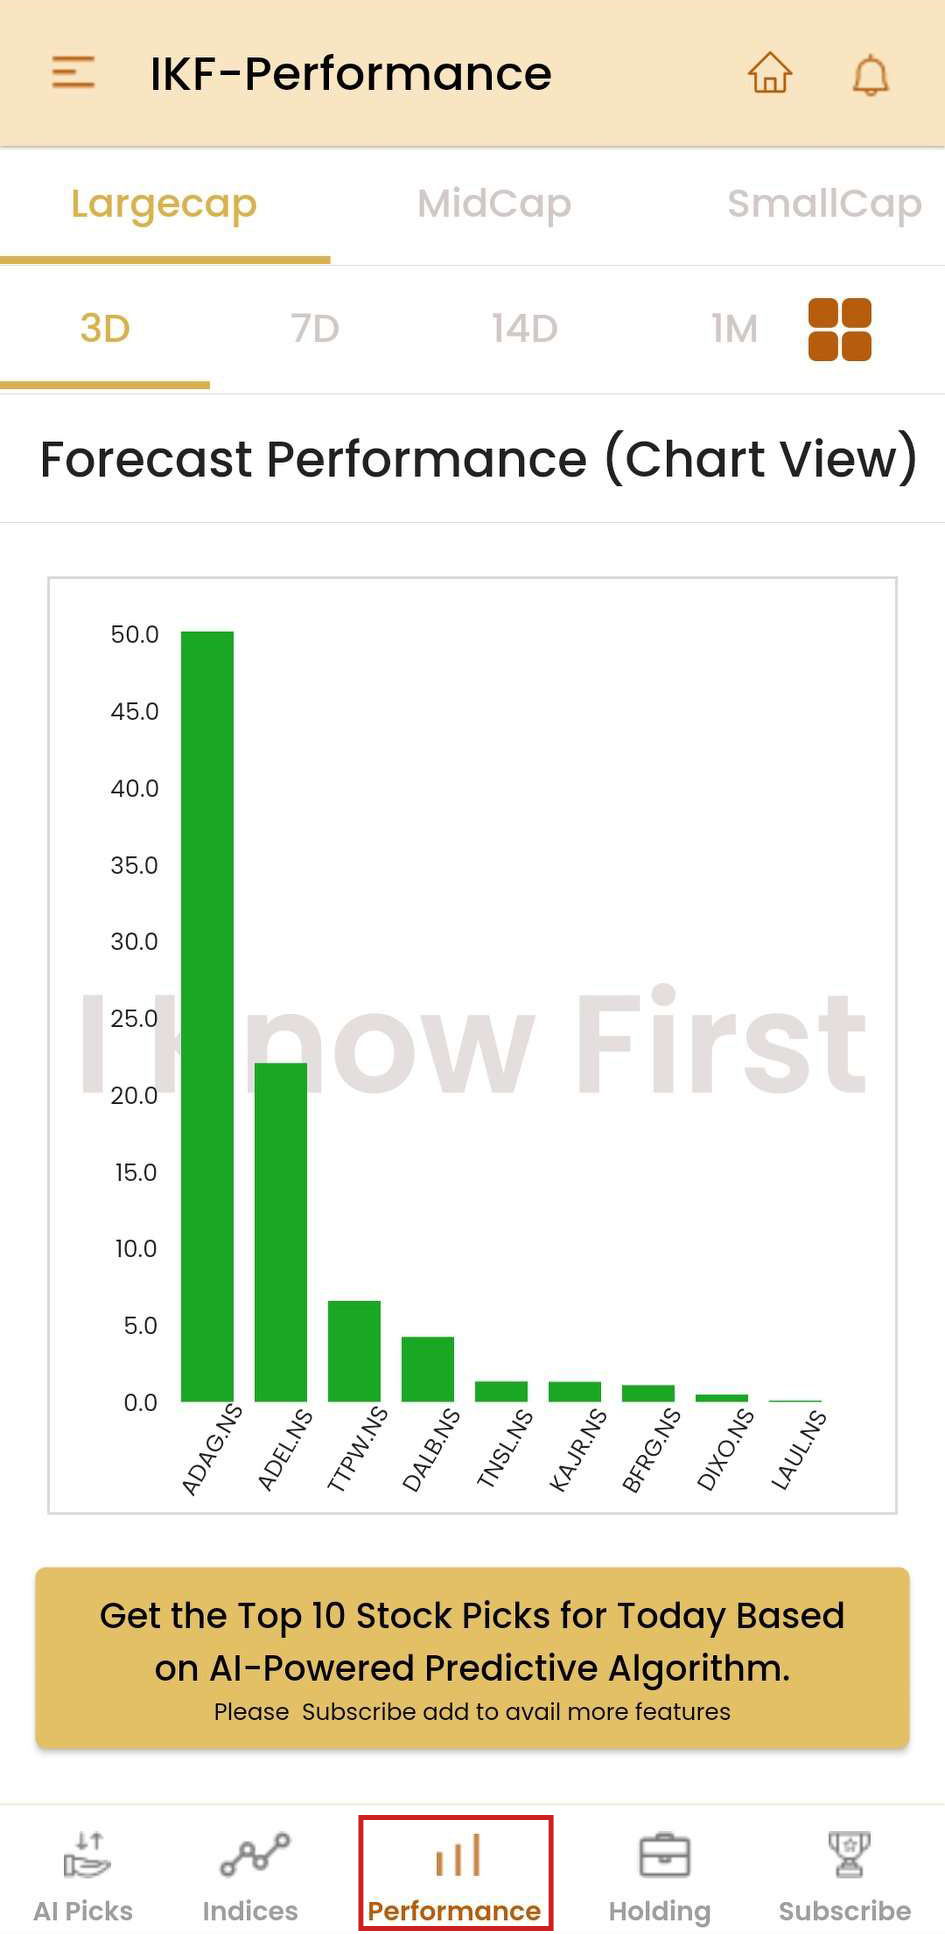
- Under the ‘AI-Picks’ section, users would be able to see the AI-based forecast for the stocks for the selected time frame and sector. (Ref Image – 7)
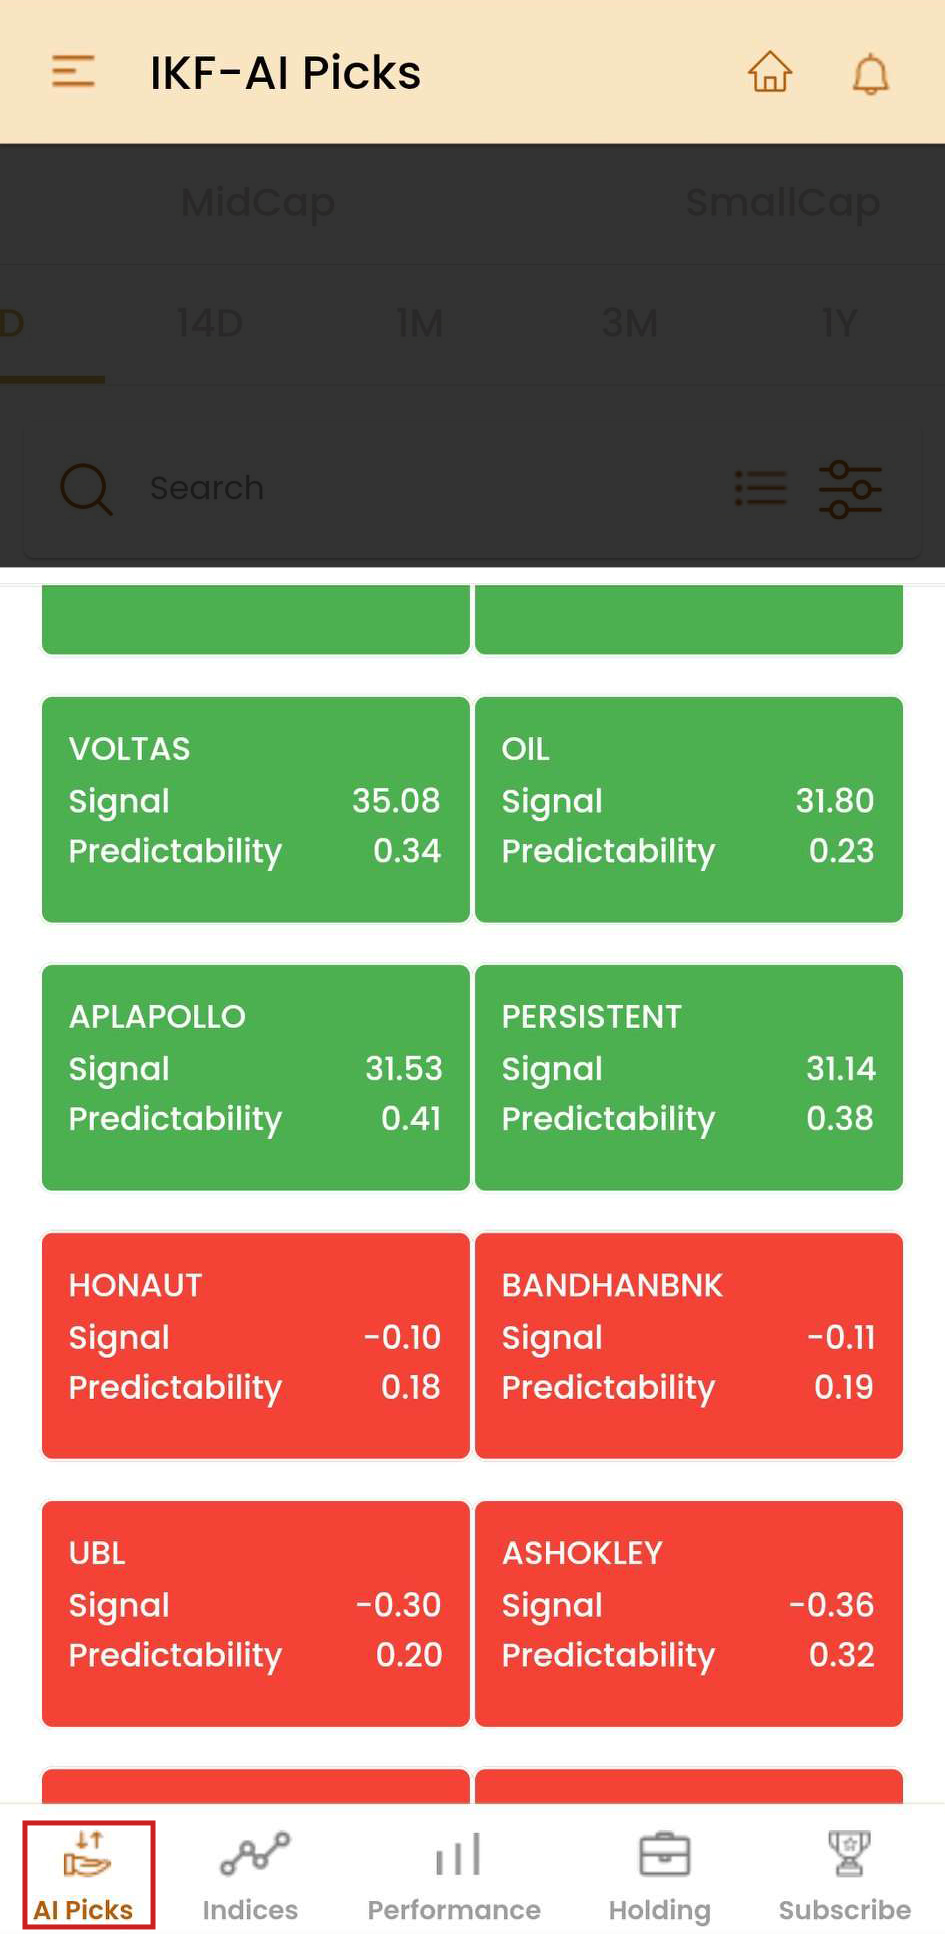
(i)You can click on this tab to see the top 60 stock picks in each time frame, analyzed from the list of up to 1500 stocks from Indian Exchanges, categorised into three – large-cap, midcap, and smallcap.
(ii). Click on any of the categories, and you will see the top 10 buy (GREEN) and top 10 sell (SELL) signals for each category, along with the predictability percentage for each stock.
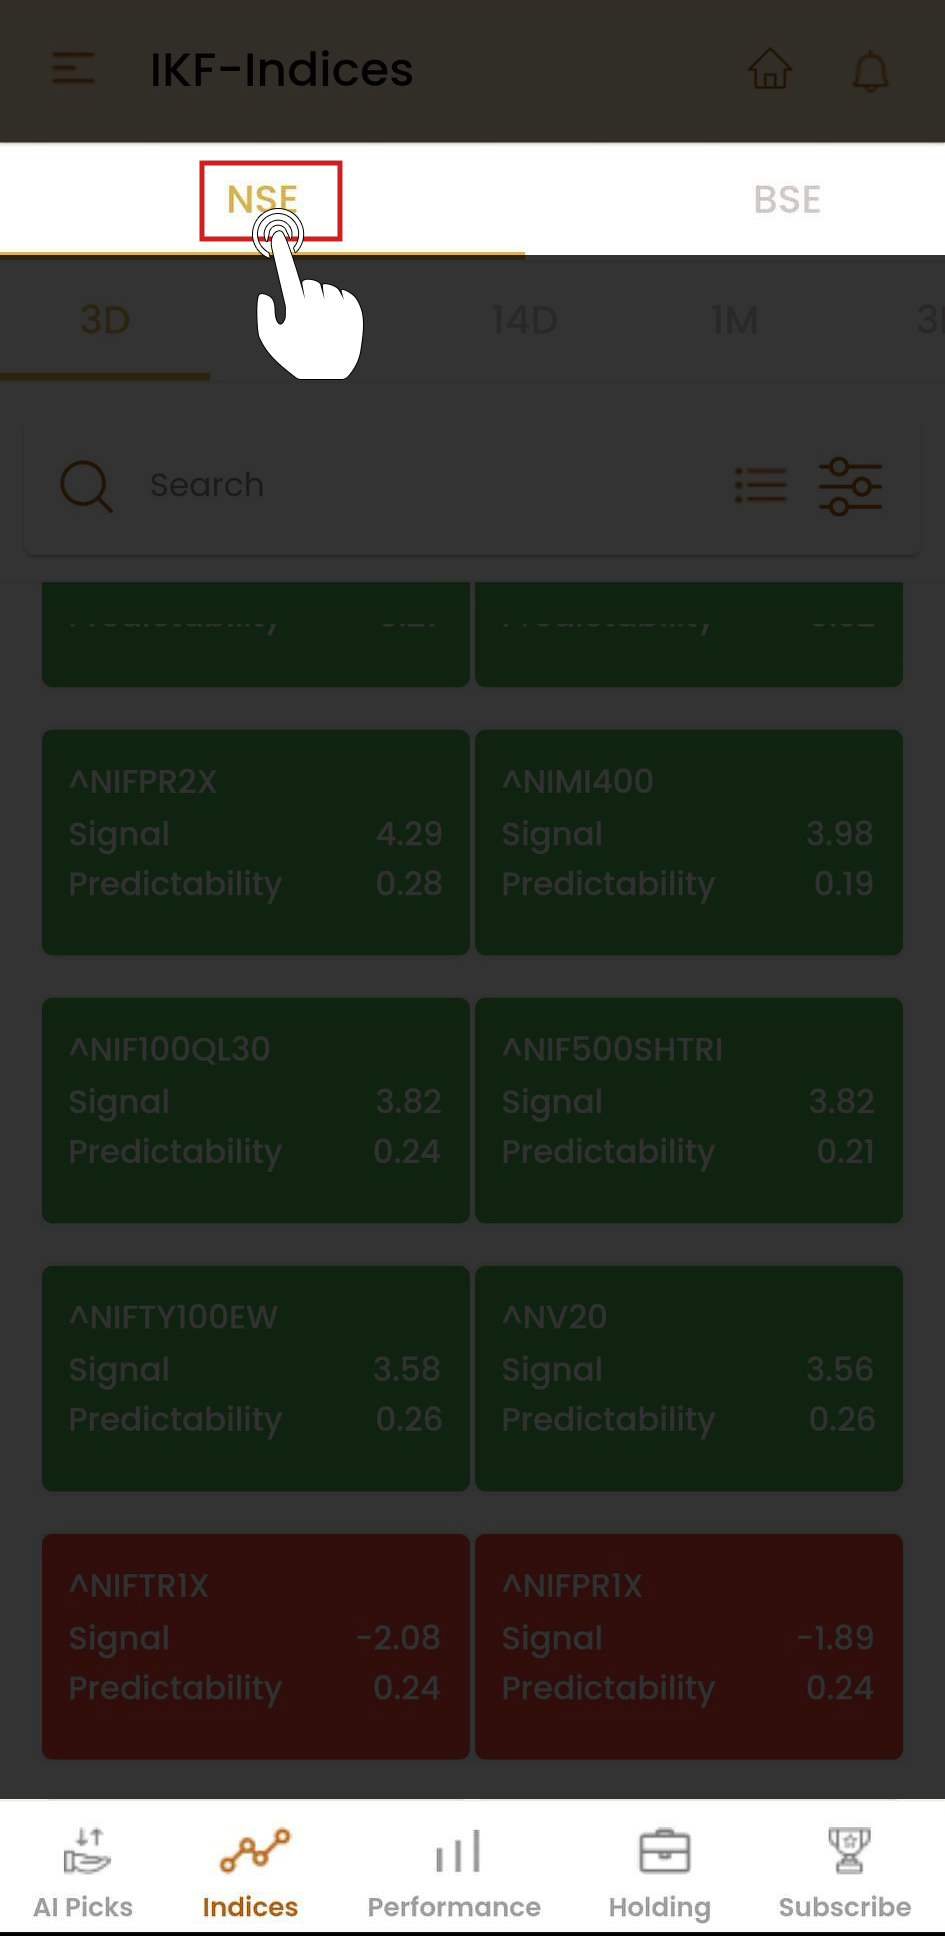
(iii) On the top, you can also check the stock market forecasts (signal and predictability percentage) for each of the stock picks for up to six-time segments – 3D, 7D, 14D, 1M, 3M, and 1YR. (Ref Image – 8)
Also Read– The step-by-step process to use AI-powered signal-based analysis on Shoonya Web
For your convenience, we’ve created a step-by-step video tutorial, accessible here:
Disclaimer: This blog post is for informational purposes only and does not constitute financial advice. Trading involves risks, and past performance is not indicative of future results. Always do your own research and consult with a qualified financial advisor before making any investment decisions.
Research Analyst SEBI Regn. No. INH000011927.
Finvasia Securities Pvt Ltd (Trading App named Shoonya) and its affiliates/associates have no financial interest or beneficial ownership in the mentioned Subject Company/Companies. There are no material conflicts of interest, and no compensation has been received from the subject company in the past twelve months. Finvasia has not served as an Officer, Director, or Employee of the Subject Company/Companies and has not engaged in market-making activities for them.

Explore Our Offerings

Stocks
Trade equities across NSE and BSE with zero delivery charges. Invest, hold or sell with a seamless experience.


Future & Options
Execute complex strategies with simple tools and real-time data.

IPOs
Apply to the latest IPOs in just a few taps. Stay updated and capture opportunities as they open.